
Attention: (Images may not display. Hover your mouse over the image icon. Right-click to open in a new tab)
Cluster Statistic shows where active volume has accumulated and how buy and sell orders were distributed. It’s a supporting tool for footprint analysis. The indicator converts raw cluster data into a clean summary—so you can scan the chart faster and understand what’s happening inside the bar.
Instead of manually checking dozens of clusters, you get the key footprint context in a separate table on the chart: where activity is concentrated, how pressure shifts within the bar, and whether participation is strengthening or fading.
Use the indicator to:
-
read the footprint faster without losing detail;
-
spot atypical bars worth deeper analysis—high activity, imbalances, extremes;
-
keep the context visible while working with levels, profiles, and other order-flow tools.
Next, we’ll review the parameters you can enable in Cluster Statistic and what each one means.
Cluster Statistic parameters
Cluster Statistic provides more than 15 parameters for assessing market activity. To control what the indicator displays, simply check the options you need in the settings.
(If the image is not displayed, right – click to open it in a new window)
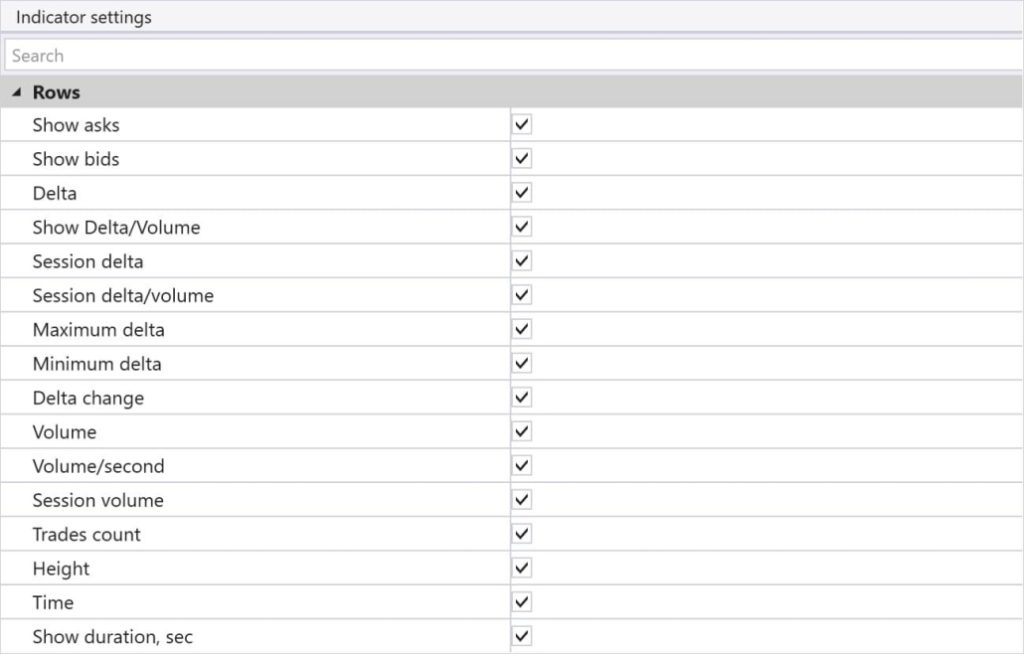
Here are the main parameters available in Cluster Statistic:
-
Asks — The number of trades executed at the Ask price.
-
Bids — The number of trades executed at the Bid price.
-
Delta — The difference between Ask and Bid trades within the current bar/candle.
-
Delta/Volume (%) — Delta as a percentage of the bar’s total volume.
-
Session Delta — Cumulative delta for the current session.
-
Session Delta/Volume (%) — Session delta as a percentage of the session’s total volume.
-
Maximum Delta — The maximum positive delta within the bar.
-
Minimum Delta — The maximum negative delta within the bar.
-
Delta Change — The change in delta from one bar to the next.
-
Volume — Total traded volume (contracts/lots/shares) within the bar/candle.
-
Volume/Second — Trading volume per second.
-
Session Volume — Total cumulative volume for the session from its start up to the current time.
-
Trades Count — The number of trades.
-
Height — The height (range) of the bar.
-
Time — The current time within the trading session.
Additional Cluster Statistic settings
ATAS allows traders to flexibly customize Cluster Statistic to fit their needs.
-
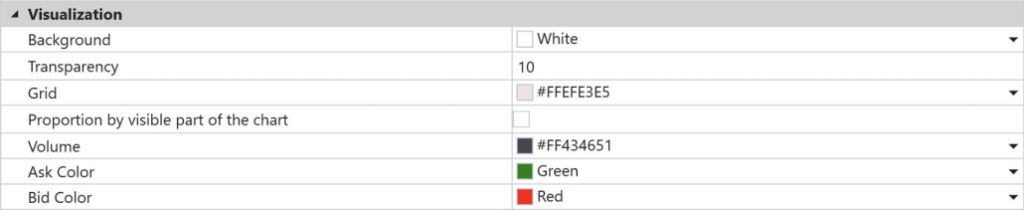
Visualization: you can choose which specific parameters are displayed on the chart—such as total volume, delta, number of trades, and more.
(If the image is not displayed, right – click to open it in a new window)
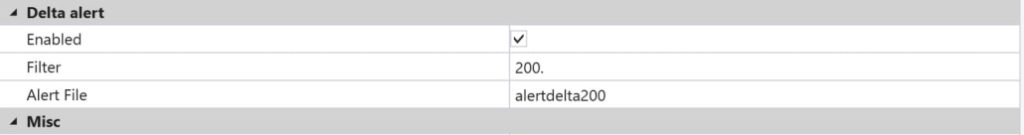
Delta filter: lets you set a specific threshold or value range that will trigger an alert once reached. For example, when delta hits a defined level, the alert helps you react quickly to changes in market conditions.
Setup example: you want to be notified when delta turns positive and rises above +200 (signaling buyer dominance). In Cluster Statistic settings, you can set an alert for delta exceeding that level, so ATAS notifies you with a sound or a pop-up window.
(If the image is not displayed, right – click to open it in a new window)
Why is this useful?
Imagine you’re analyzing the market and you only want to enter a trade when buyer dominance becomes obvious. Setting an alert for positive delta helps you catch the moment when buying activity spikes. This lets you make trading decisions faster and reduces the time spent on manual analysis.
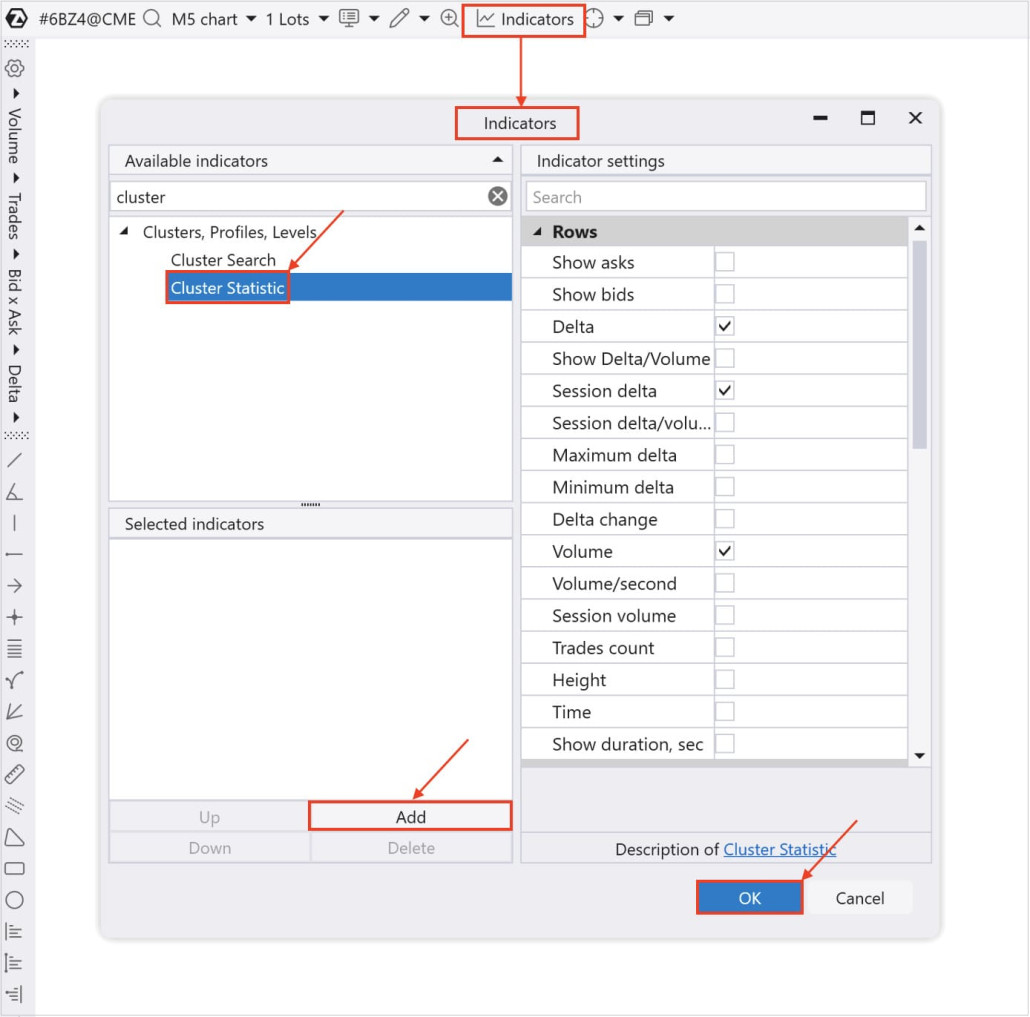
How to add the Cluster Statistic indicator to a chart
You can do it in 7 steps:
-
Click “Chart” in the Home window
-
Select any instrument: stocks, futures, or cryptocurrencies
-
Press Ctrl+I or click the Add Indicator icon
-
Find “Cluster Statistic” in the Indicators window
-
Click “Add” and then “OK”
(If the image is not displayed, right – click to open it in a new window)
How to scale into a position using Cluster Statistic
Cluster Statistic provides more market context, helping you make more informed decisions about entering a position and adjusting its size as price moves. The process of adding to an existing position is called scaling in.
Scaling in can potentially improve results during trending moves. However, it also increases exposure and requires careful market analysis, clear criteria for adding size, and disciplined risk management.
Key principles of scaling in
1) Assess market sentiment using delta and volume
When scaling in, it’s important to confirm that the current direction is still intact and supported by buyers or sellers. Watch delta and volume at key levels. If positive delta and volume rise together, it signals trend continuation and can justify adding to the position.
Example: You’re holding a long position and see price break a resistance level with positive delta and rising volume. Adding makes sense—buyers are showing sustained dominance.
2) Use Session Delta to confirm the trend
Session Delta shows cumulative delta over a period and helps evaluate overall market sentiment. If Session Delta remains high or changes only slightly during pullbacks, the primary trend is still intact—so you can add size more safely.
Example: After entering a trade, price pulls back to a support level, but Session Delta stays high. That supports adding exposure—buyers still dominate.
3) Use Trades Count to gauge participant activity
Trades Count helps measure overall market activity. When scaling in, watch for activity spikes and an increase in the number of trades—especially when it aligns with delta and volume confirmation. A sharp jump in trades during a break of key levels suggests the market is ready to continue moving.
Example: You’re holding a short position and notice price breaks an important support level with a sharp rise in the number of trades. That can be the moment to add—sellers are showing strength.
Your goal at this stage
Your goal is to make Cluster Statistic clean, readable, and useful for everyday footprint work.
Once you select the parameters you need and set additional delta/volume settings and alerts, the table on your chart becomes a reliable information dashboard you can read in seconds.
Method 1: Identifying volume accumulation zones (Volume)
This method uses the Volume row in Cluster Statistic to find areas of significant volume accumulation—potential support or resistance levels.
Method overview: High-volume clusters point to zones of active trading. These zones can represent levels where buyers and sellers fight for control, or where large participants are building positions.
Step-by-step strategy:
-
Use Cluster Statistic to spot candles with abnormally high volume.
-
Place Market Profile & TPO over the candle with abnormal volume and identify the Point of Control (POC). If price cannot break through the high-volume level, it signals a potential resistance or support zone.
Bullish example:
Suppose you notice a candle with abnormally high volume in Cluster Statistic. Price moves up and retests that level multiple times without breaking it. If volume continues to build at that level and delta confirms buyer strength, it can support a bullish scenario.
(If the image is not displayed, right – click to open it in a new window)
-
-
Cluster Statistic shows abnormally high volume.
-
Place Market Profile & TPO over the abnormal-volume candle and identify the POC (Maximum Level).
-
Price holds above the POC (Maximum Level) and bounces from it.
-
A potential bullish scenario.
-
You can place the Stop Loss below the abnormal-volume candle, and Cluster Statistic can help indicate when to take profits (Take Profit).
Bearish scenario example
In a downtrend, a candle with unusually high volume forms a key zone to monitor—especially if price is trading below it. Retesting this zone helps you assess whether selling pressure is still present and how it fits into your trading plan.
-
(If the image is not displayed, right – click to open it in a new window)
-
Cluster Statistic shows abnormally high volume.
-
Place Market Profile & TPO over the abnormal-volume candle and identify the POC (Maximum Level).
-
Price holds below the POC (Maximum Level) and bounces off it.
-
A potential entry for a bearish trade.
-
Place the Stop Loss above the abnormal-volume candle. Cluster Statistic can help indicate when to take profits (Take Profit).
Method 2: Identifying market sentiment using Delta
In this method, we focus on the Delta row in Cluster Statistic to identify which side is dominant and decide the trade direction.
Step-by-step strategy:
-
Find levels with abnormally high positive or negative delta — they signal clear buyer or seller dominance.
-
Use the delta color and value to confirm trade direction.
Bullish scenario example:
Suppose price reaches a support level on the chart and starts to turn upward. At that moment, Cluster Statistic shows a high positive delta. This may indicate that buyers are willing to defend the level—especially if activity at that level is also increasing.
The same logic applies when price is in an uptrend: positive deltas often act as support zones and confirm bullish momentum.
(If the image is not displayed, right – click to open it in a new window)
Price found support and reversed upward.
At the same time, Delta moves into a strongly bullish zone, indicating a significant number of Ask-side trades hitting the market.
Volume increases as Delta rises, confirming strong bullish participation.
If price holds above the candle with high positive delta and high volume, this supports the bullish interpretation. Use this area as a reference point and evaluate it within your trading plan and risk-management rules.
You can place the stop loss below the candle with strongly positive delta and high volume, or below recent lows. Cluster Statistic can also help indicate when it’s time to take profits.
Bearish scenario example
Suppose price reaches a resistance level, and at the same time Cluster Statistic starts showing a high negative delta with price repeatedly bouncing lower. This may mean sellers are taking control at that level.
Similarly, if price is in a downtrend and you observe negative delta in Cluster Statistic, it is a strong confirmation of trend continuation and bearish momentum.
(If the image is not displayed, right – click to open it in a new window)
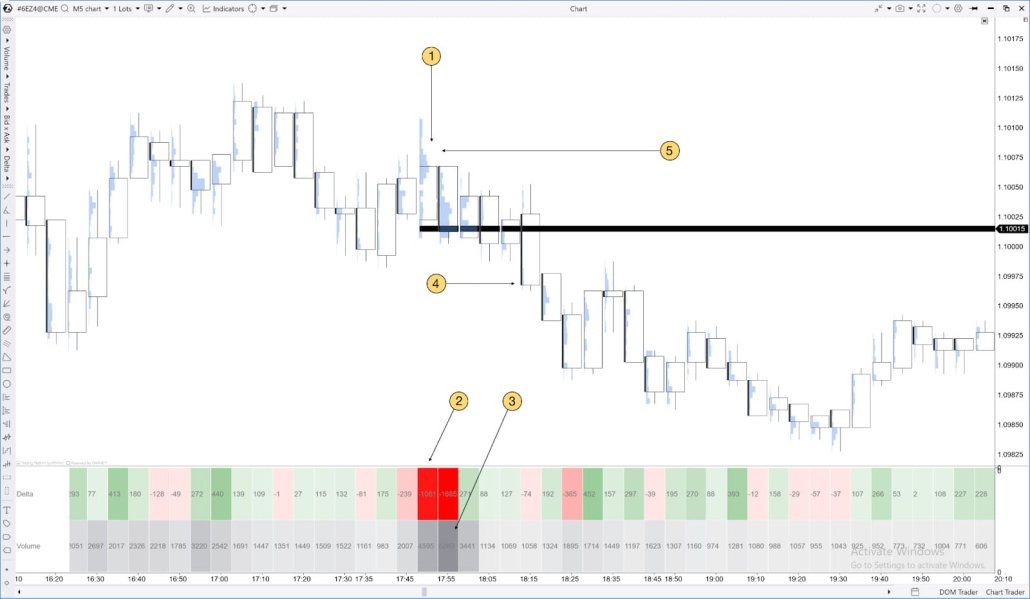
Price found resistance at 1.10100 and reversed downward.
At the same time, Delta moves into a strongly bearish zone, indicating a significant number of Bid-side orders hitting the market.
Volume increases as Delta declines, confirming strong selling activity.
You may consider entering a short trade once price breaks below the candles showing abnormally negative delta and high volume.
A stop loss can be placed above the candles with abnormally negative delta and high volume. Cluster Statistic can also help indicate when it’s time to take profits.
Method 3: Session Delta analysis
This method helps you assess overall market sentiment and trend direction using cumulative delta from the start of the trading session.
Step-by-step strategy:
-
If Session Delta shows steady growth, it may reflect buyer dominance and support a bullish read in the current context.
-
If Session Delta declines, it may reflect stronger selling pressure and support a bearish read—especially when confirmed by volume and nearby key levels.
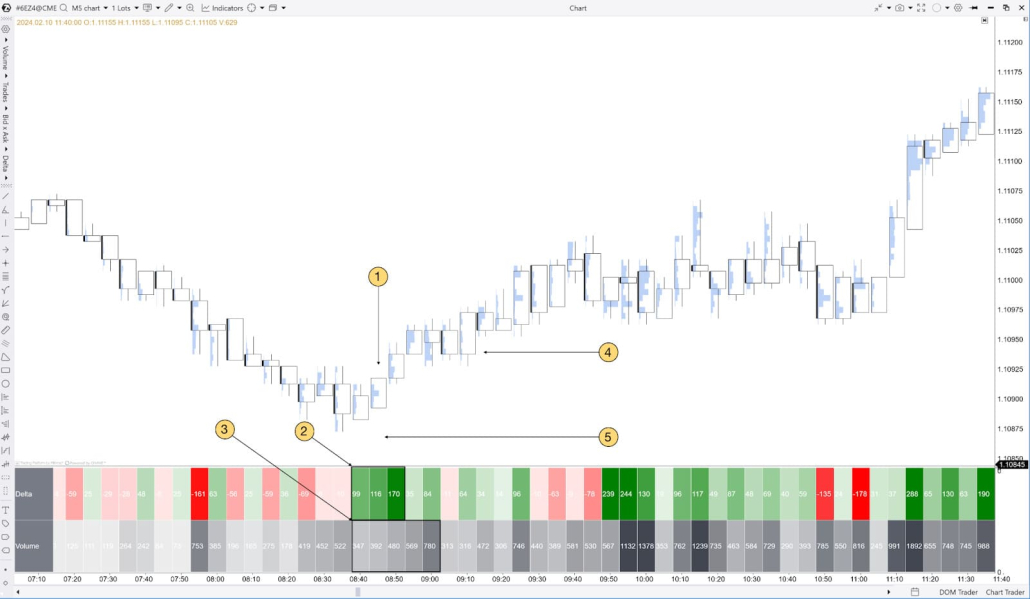
How to confirm a bullish trend using Session Delta
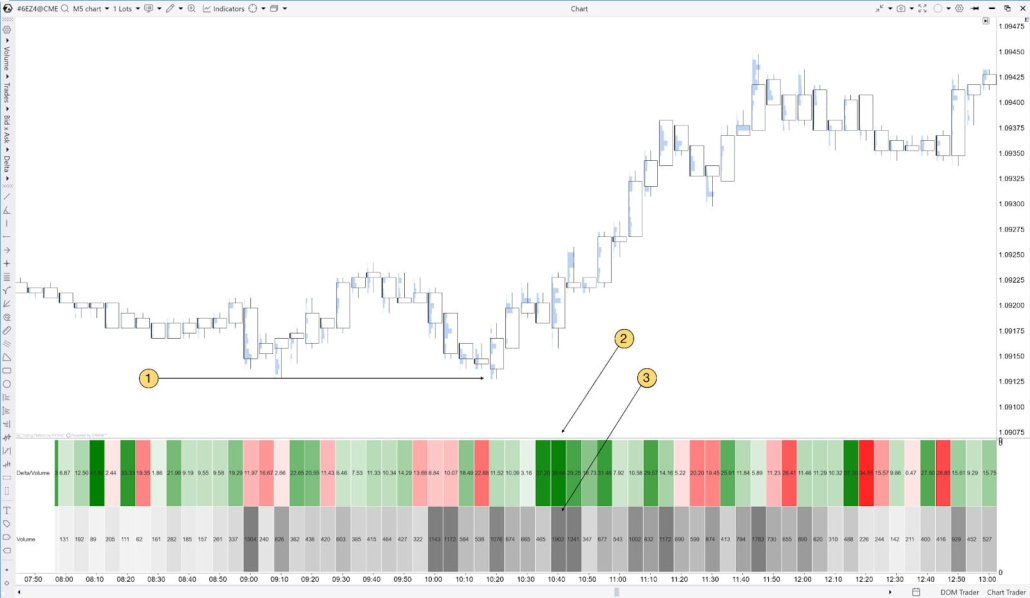
If Session Delta rises consistently from the start of the session and price action also points to an up move, this can confirm buyer strength. When price pulls back to a key support level that is confirmed by rising Session Delta, traders may consider opening long positions.
(If the image is not displayed, right – click to open it in a new window)
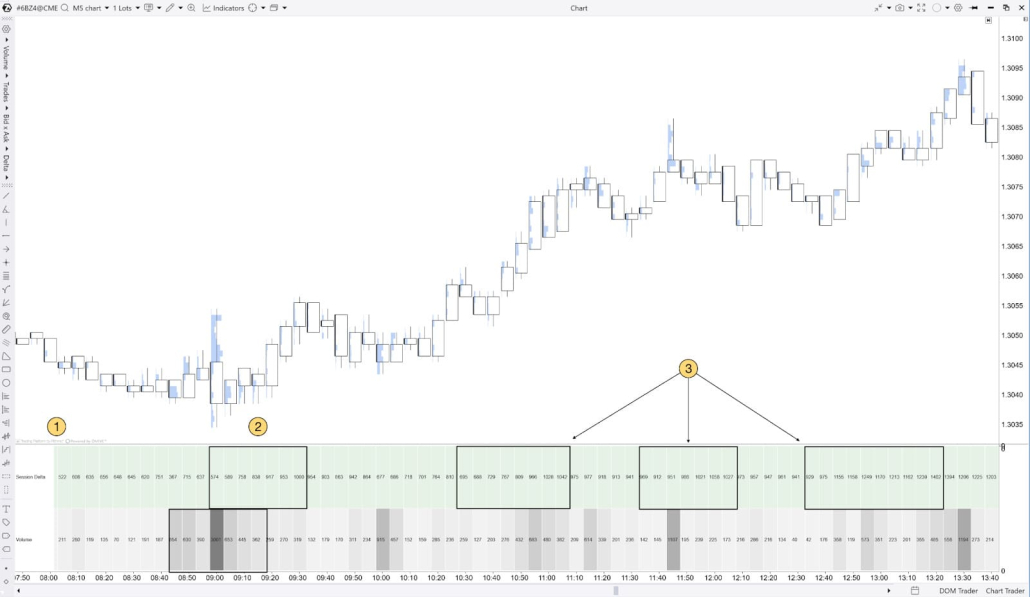
The European session opens at 08:00 Central European Time (CET).
Around 09:00, Session Delta starts rising along with increasing volume.
If Session Delta keeps climbing steadily from the start of the session while price continues to move higher, this may indicate sustained buying pressure—a context in which it makes sense to look for bullish continuation on your chart.
How to confirm a bearish trend using Session Delta
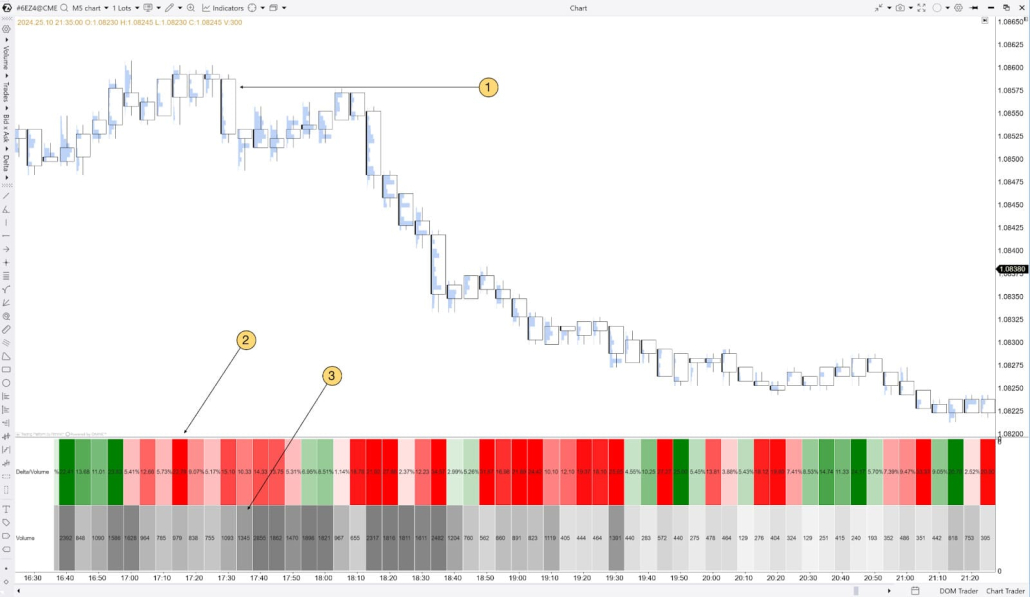
If Session Delta steadily declines from the start of the session while price continues moving lower, this may indicate sustained selling pressure and confirm bearish momentum in the current context.
(If the image is not displayed, right – click to open it in a new window)
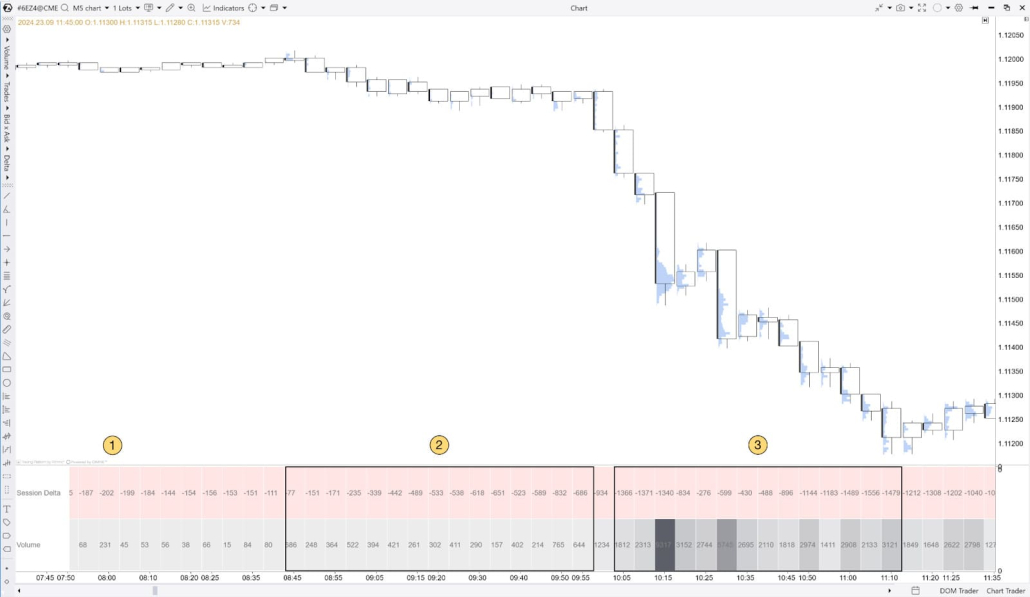
The European session opens at 08:00 Central European Time (CET).
Around 09:00, Session Delta starts falling while volume increases. These conditions confirm a strong bearish trend and open the door for short positions.
As price continues its downtrend throughout the day, Session Delta keeps declining, confirming the need to hold—or even add to—existing short positions.
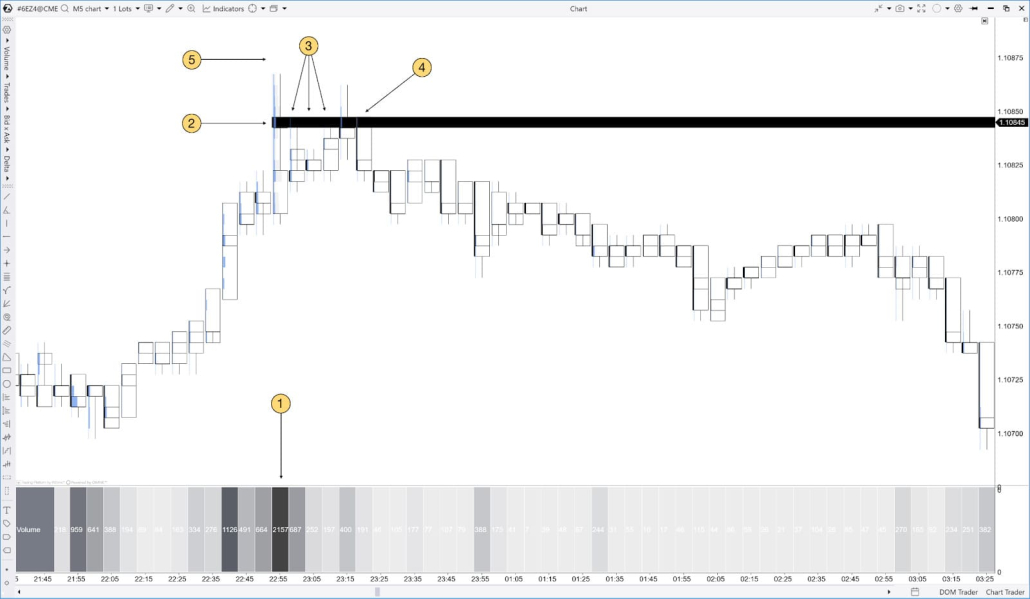
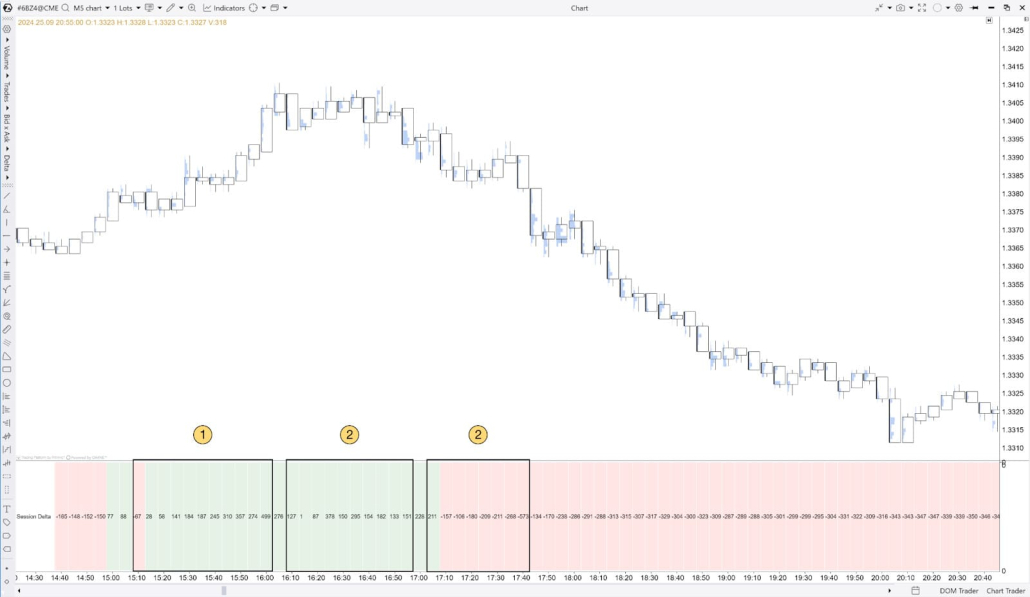
What about divergence?
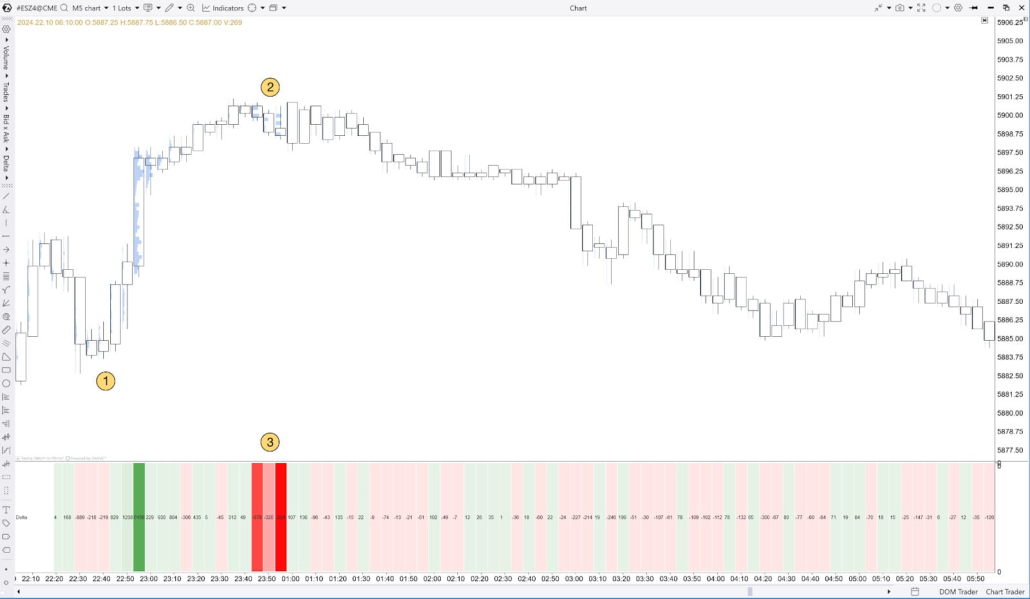
Session Delta in Cluster Statistic can also help you spot potential traps. For example, if Session Delta continues to rise while price stays in a tight consolidation (unlike the two cases above), this may point to aggressive buying that fails to lift price. In many cases, it’s worth treating such divergence as a warning signal and watching for a possible continuation to the downside—especially if other contextual factors confirm it.
(If the image is not displayed, right – click to open it in a new window)
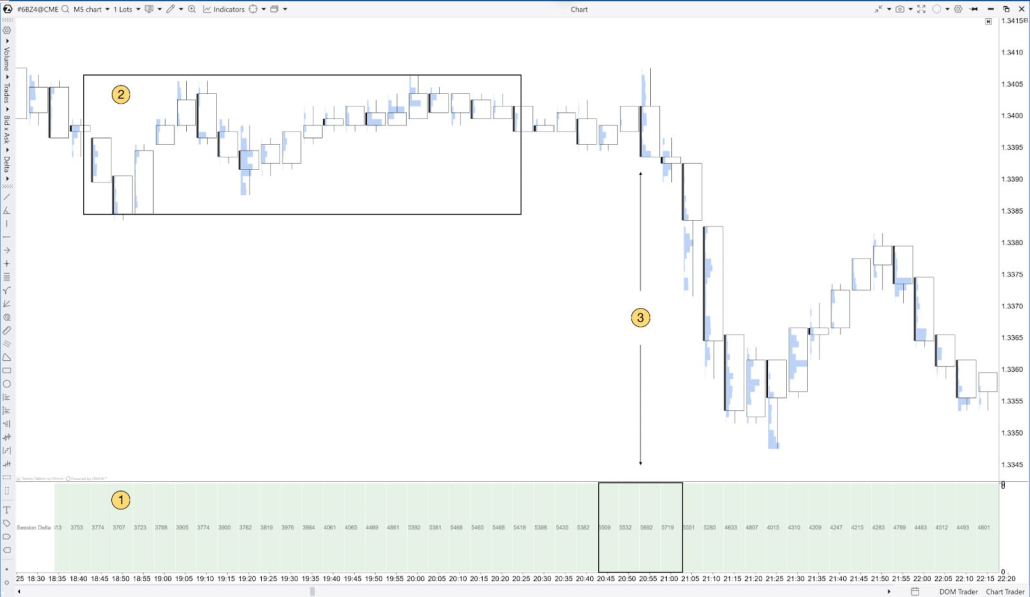
-
Session Delta rises steadily.
-
Price consolidates despite the rise in Session Delta.
-
Session Delta peaks at the same time the final price high is formed. As price starts to fall, Session Delta begins to decline as well, signaling the start of a downward move.
The reverse is also true: if Session Delta is falling while price is consolidating, it suggests large market participants are not willing to let price drop, and this often acts as a bullish signal.
(If the image is not displayed, right – click to open it in a new window)
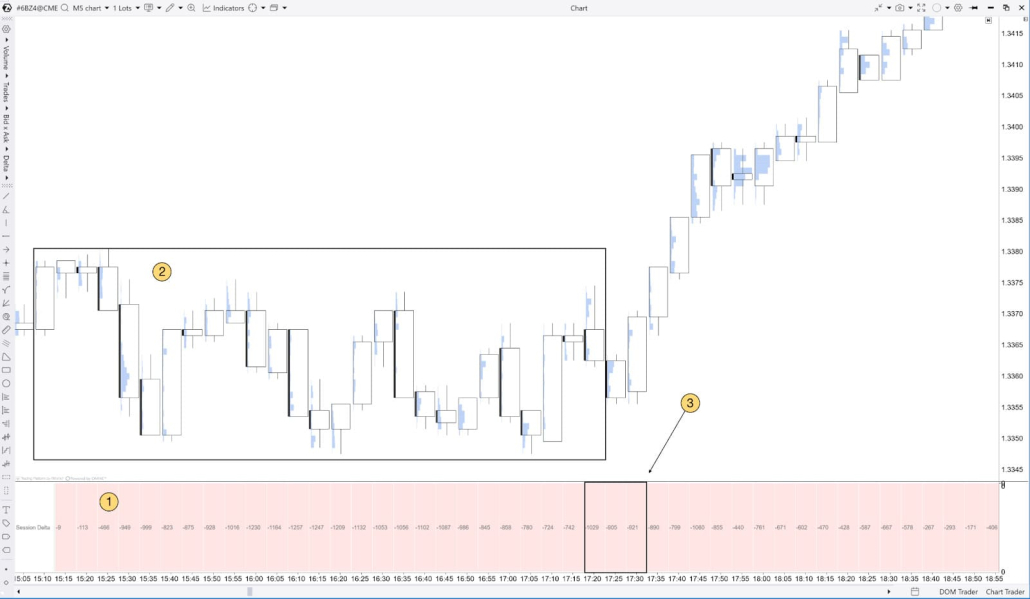
-
Session Delta steadily declines.
-
Price consolidates despite the decline in Session Delta.
-
Session Delta reaches its lowest value at the same time the final price low is formed. Session Delta then starts to rise as price rallies sharply, signaling the start of an uptrend.
Method 4: Using “Maximum Delta” to identify reversal points
Step-by-step strategy:
-
Find candles with maximum delta, especially near key support or resistance levels.
-
Analyze how price reacts at those levels. If price cannot break through the level associated with maximum delta, it may signal a reversal.
How to identify a bullish reversal using Maximum Delta
If price tests a level with maximum delta and repeatedly holds above it, this may indicate seller exhaustion—price may continue higher.
(If the image is not displayed, right – click to open it in a new window)
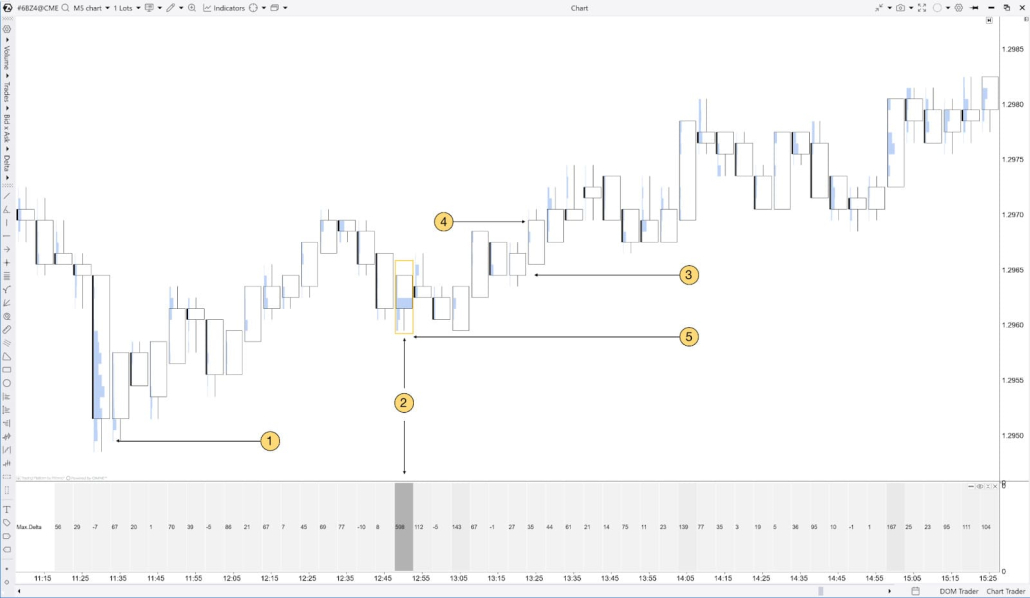
Price forms a low and reverses upward.
On the pullback near a newly formed key support, a candle with Maximum Delta appears.
Price consistently holds above the Maximum Delta candle—this signals buyer strength and can serve as a potential entry point.
If price continues to rise and stays above the candle with strong positive delta (especially on high volume), many analysts view this as a bullish signal. You can use this area as a reference level and evaluate whether it fits your plan and risk-management rules.
A stop loss can be placed below the Maximum Delta candle—now it acts as support. A take profit level can be determined using Cluster Statistic.
How to identify a bearish reversal using Maximum Delta
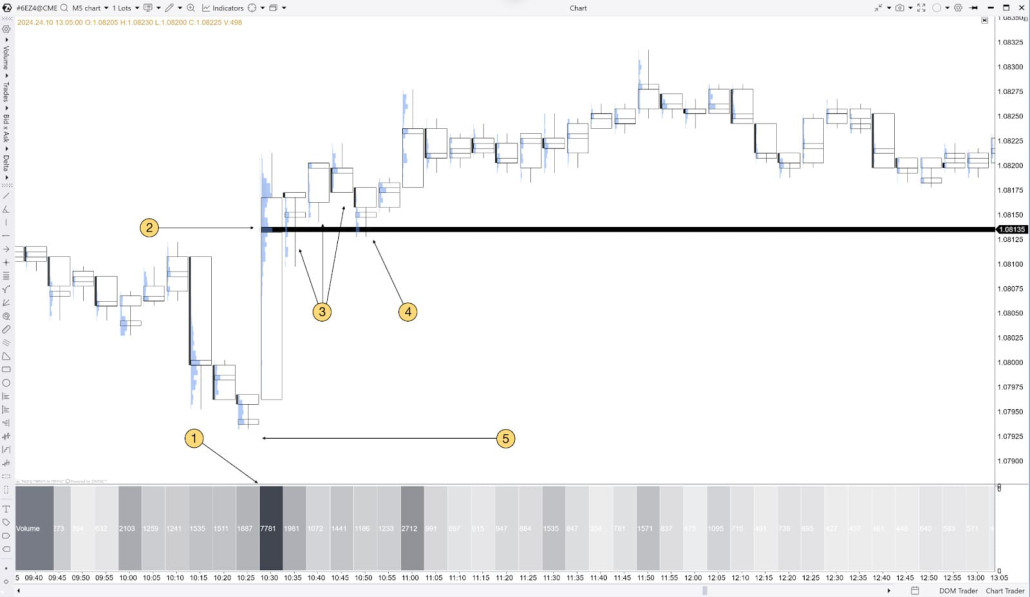
If a candle with a high Maximum Delta appears at the peak of an uptrend, but price momentum starts to slow, this may indicate buyers are losing control—suggesting a potential reversal to the downside.
(If the image is not displayed, right – click to open it in a new window)
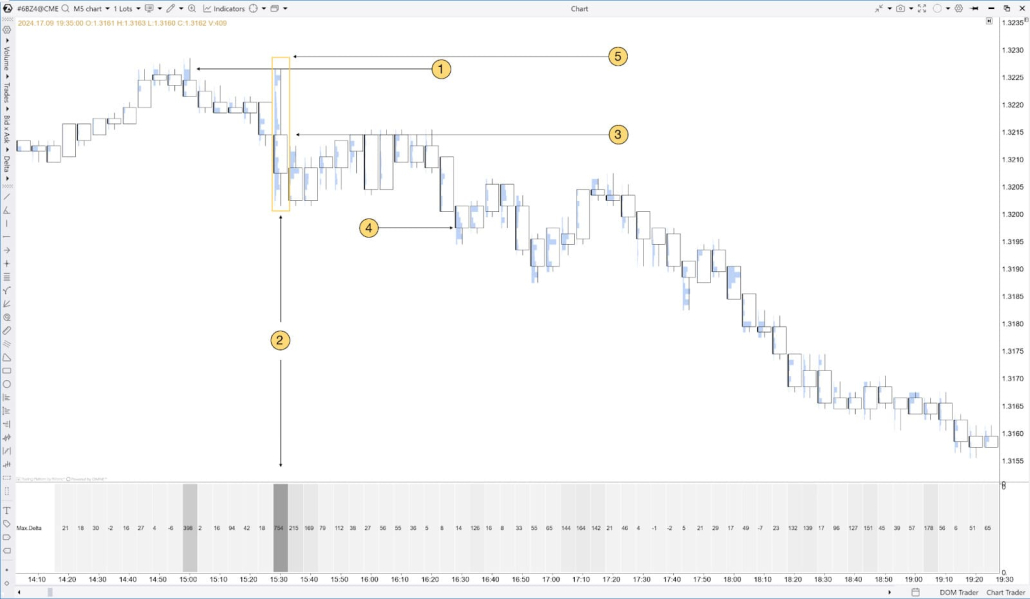
Price forms a high and reverses downward.
On the pullback to a newly formed key resistance, a candle with Maximum Delta appears.
Price consistently holds below the Maximum Delta candle—this indicates weakening buyers and can serve as a potential entry point for short trades.
If price drops below the Maximum Delta candle, it may mean selling pressure is increasing. Use this candle as a reference level and evaluate whether the move is likely to continue on the next bars.
A stop loss can be placed above the Maximum Delta candle—now it acts as resistance. A take profit level can be determined using Cluster Statistic.
Method 5: Finding support and resistance levels using “Minimum Delta”
Step-by-step strategy:
-
Identify candles with Minimum Delta, especially near key support levels.
-
If price tests a Minimum Delta level multiple times without breaking it, this may indicate support is forming.
Bullish scenario example:
Suppose price falls toward a Minimum Delta level and you observe rising volume there. This may indicate that large players are starting to buy and that an upside reversal could follow.
(If the image is not displayed, right – click to open it in a new window)
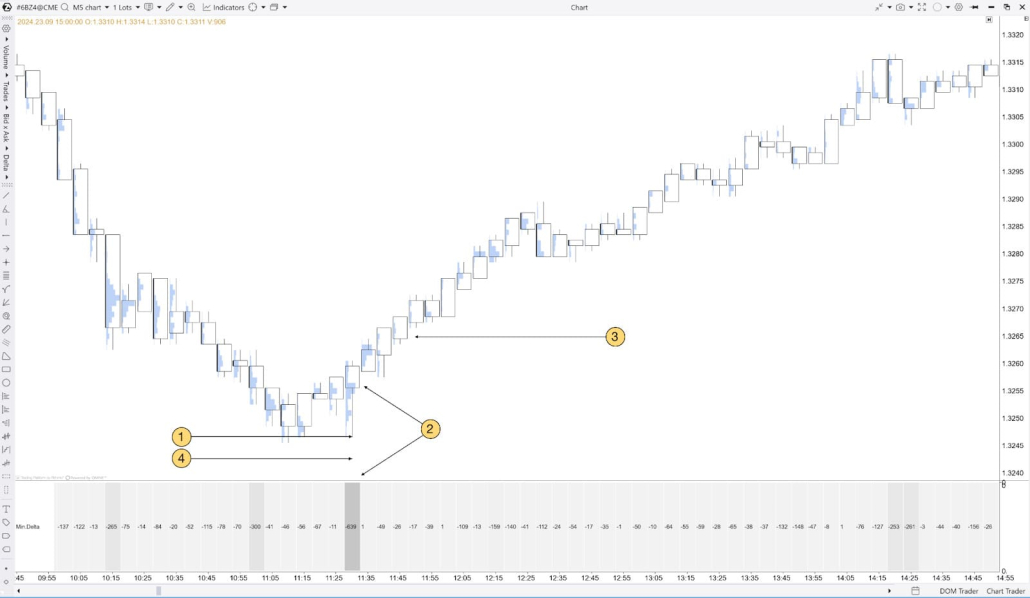
Price found support at 1.3247 and bounced upward.
On the pullback to support, a Minimum Delta candle forms, indicating seller exhaustion and a potential reversal higher.
Holding above the Minimum Delta candle serves as a potential entry point.
A stop loss can be placed below the Minimum Delta candle, and the profit-taking moment can be determined based on the shift observed in Cluster Statistic.
Bearish scenario example
If price approaches a resistance level and the previous test of that level showed Minimum Delta, this may indicate sellers are ready to defend that level.
(If the image is not displayed, right – click to open it in a new window)
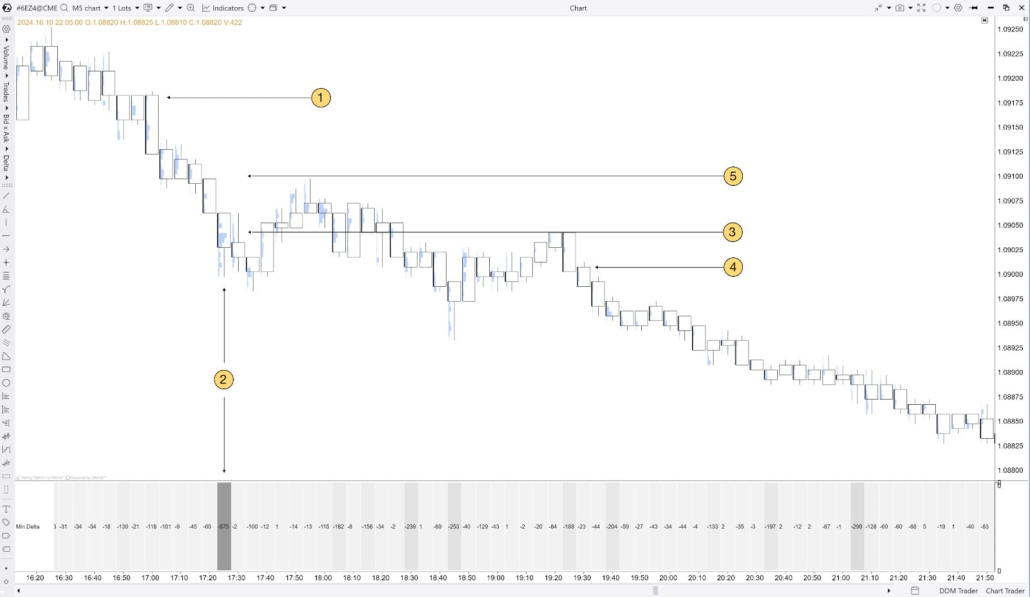
Price is in a downtrend.
In the middle of the downward move, a Minimum Delta candle forms.
When price drops below the Minimum Delta level, it indicates strong selling pressure and a high probability that the downtrend will continue.
A potential short entry appears after price rejects (fails to reclaim) the level of the Minimum Delta candle.
A stop loss can be placed above the Minimum Delta candle, and the profit-taking moment can be determined based on the shift observed in Cluster Statistic.
Method 6: Assessing market sentiment using Delta/Volume
Step-by-step strategy:
-
Analyze bars with a high Delta/Volume percentage, especially at key support and resistance levels.
-
If the Delta/Volume percentage shows steady growth at a certain level, it indicates strength from buyers or sellers.
Long setup example:
If, at a key support level, the Delta/Volume percentage rises together with increasing volume, buyers are actively defending the level and further upside movement is likely.
(If the image is not displayed, right – click to open it in a new window)
Key support level.
When price reacts to the key support level (1), the Delta/Volume percentage rises together with an (3) increase in volume.
Short setup example
If the Delta/Volume percentage drops sharply at a resistance level, it suggests buyers are running out of strength and a downward price reversal may follow.
(If the image is not displayed, right – click to open it in a new window)
Key resistance level.
When price reacts to the key resistance level (1), the Delta/Volume percentage falls together with an (3) increase in volume.
Method 7: Using Trades Count to assess market activity
Step-by-step strategy:
-
Track increases in the number of trades, rising volume, and changes in delta.
-
Use activity spikes to confirm the strength of the current trend or to signal a potential reversal.
Example: spotting reversals using Trades Count
-
If, after a prolonged rise, the number of trades drops sharply, the trend is weakening and a downside reversal may follow.
-
The opposite is also true: a sharp increase in the number of trades together with positive delta and rising volume points to an upside reversal.
(If the image is not displayed, right – click to open it in a new window)
How to use Cluster Search to identify exit zones when market sentiment shifts
When market sentiment changes, it’s important to have an exit plan to protect profits or minimize losses. To do this, use Cluster Search together with the Delta and Session Delta metrics.
Using Delta for profit-taking
If Delta drops sharply or turns negative in an area that buyers previously supported, it can be a signal to take profit or close the position.
(If the image is not displayed, right – click to open it in a new window)
Suppose you opened a long position.
Price starts to slow down.
At the same time, Delta in Cluster Statistic drops sharply. This is a signal that large aggressive sellers have entered the market, and price may reverse against your position.
Using Session Delta to exit when the trend changes
If Session Delta shows signs of reversing or its growth slows during an uptrend, this may indicate weakening buyers and warn of a possible change in direction.
(If the image is not displayed, right – click to open it in a new window)
Session Delta rises together with the upward price move.
Session Delta shows signs of a reversal—it starts consolidating as price momentum slows.
Session Delta then falls, indicating a shift in market direction.
Using Trades Count to take profit when buyer/seller strength fades
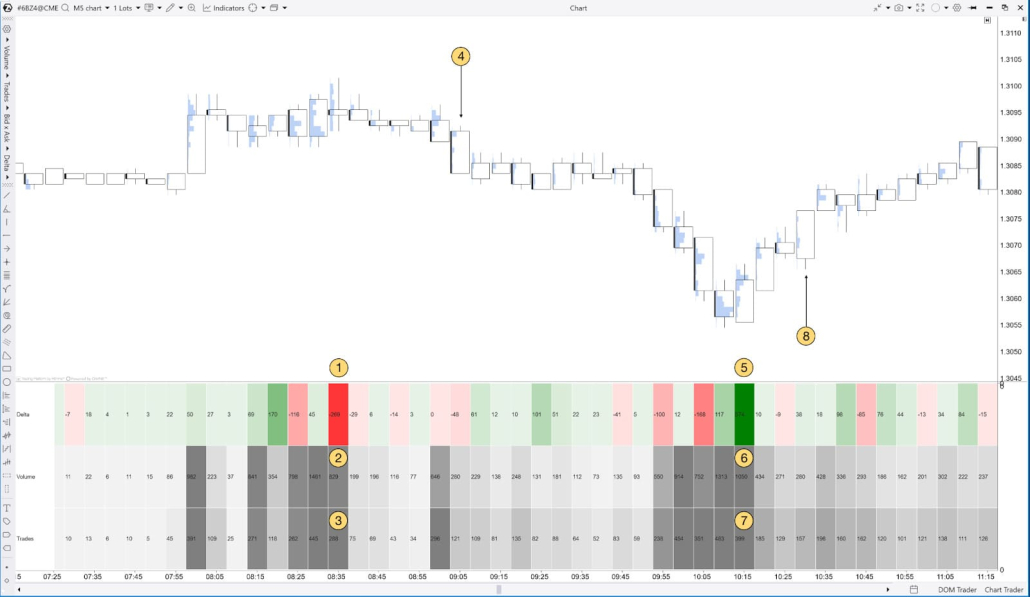
If Trades Count decreases after a prolonged price move (up or down), it may signal that the trend is weakening. In this situation, it’s recommended to take profit and exit the trade. For example, in an uptrend, a consistent decline in the number of trades across several bars can mean participant activity is fading and the move is losing momentum—raising the probability of a pullback.
(If the image is not displayed, right – click to open it in a new window)
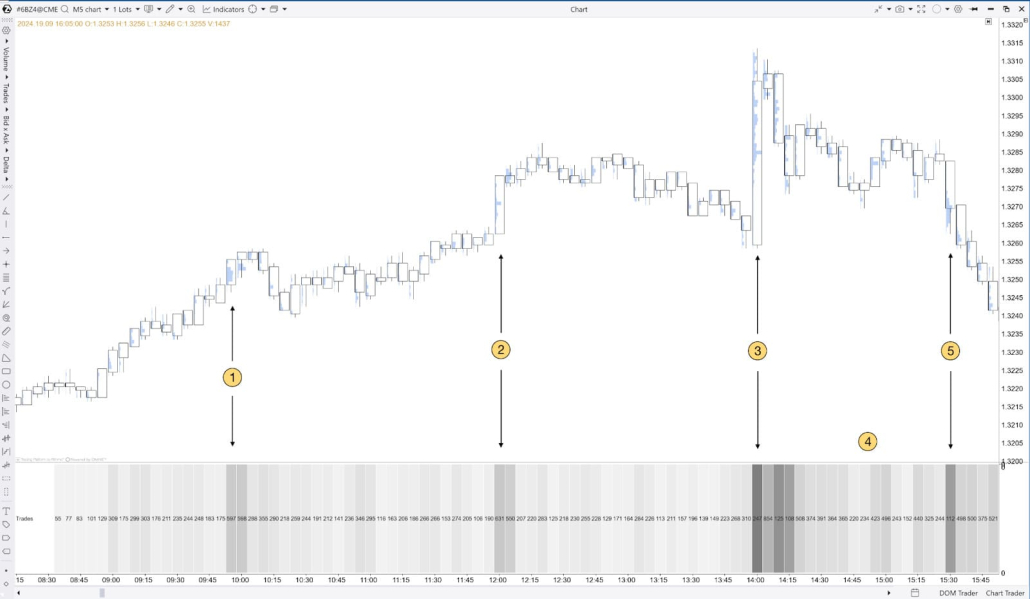
(1) and (2) — Price is in an uptrend and buyers are supporting the move. In Cluster Statistic, you can see a large number of trades only on bullish candles. This indicates buyer strength.
(3) Price makes a final push upward. Cluster Statistic shows an abnormally large number of trades.
(4) After the last push, price dips slightly while Trades Count falls at the same time.
(5) Traders re-enter the market as price reverses. The rise in Trades Count shows traders are supporting bearish momentum, and the bullish trend has ended.
Conclusion
The seven methods in this guide provide a simple workflow: scan the table, highlight standout bars, and only then analyze the clusters where it truly matters. That’s the core idea of Cluster Statistic—less noise, faster reading, and more consistent footprint interpretation.
Cluster Search helps you work even faster: it finds bars that match your conditions and highlights areas that can serve as exit zones—so you can check and confirm your scenarios directly on the chart.
![]()