Market Selection: The first step is to choose an asset for trading. This could be a currency, stock, commodity, or cryptocurrency. Typically, a trader looks for an asset whose price fluctuations do not form a consistent trend.
Range Determination: The trader assesses the price range within which they expect the asset’s price to fluctuate. For example, if the current asset price is $100, the trader might set a trading range from $90 to $110.
Breaking the Range into Levels: The trading range is divided into equal levels or a “grid.” For instance, if the range is $90 to $110, the trader may establish levels every $1 (i.e., $90, $91, $92, etc.).
Order Placement: The trader evaluates the volume they can trade without exceeding their risk limit, then places orders:
- Buy Orders are placed below the current market price at each grid level.
- Sell Orders are placed above the current market price at each grid level.
Entering a Position: When the asset’s price reaches one of the set levels, the corresponding order is executed. If a buy order is triggered, the trader acquires the asset at that price and places a sell order above it. If a sell order is triggered, a short position is opened, and the trader places a new buy order below that price.
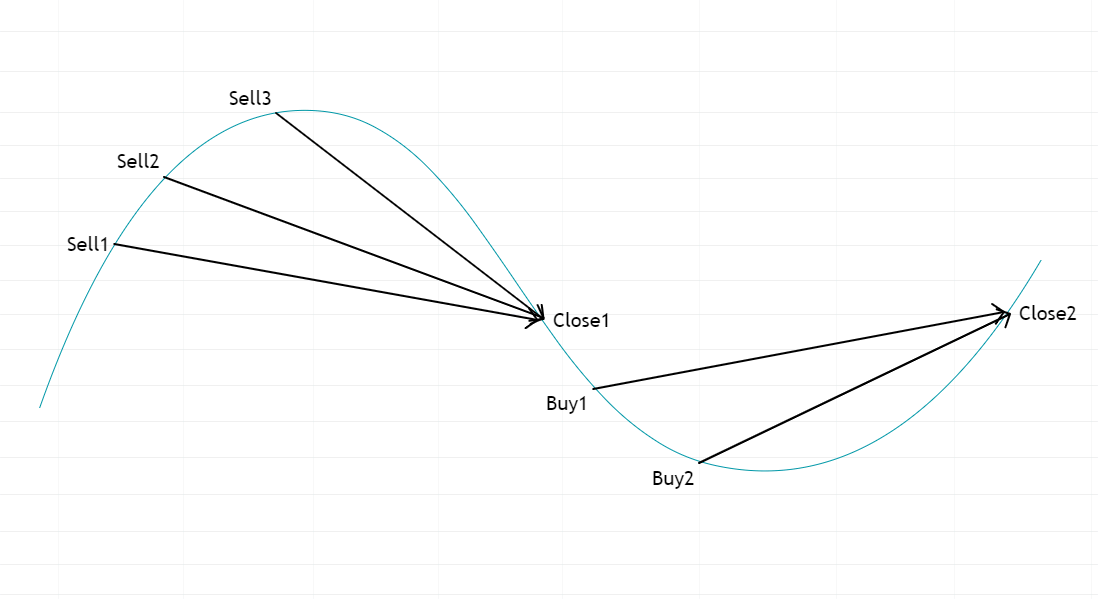
Cycle Repetition: The process continues as long as the asset price fluctuates within the specified range. The strategy automatically buys at low levels and sells at high levels, profiting from each cycle.
Types of Grids
Developing a grid trading strategy allows for numerous variations, creating a wide range of grid strategies based on different criteria:
- Static Grids: Fixed levels regardless of price fluctuations.
- Dynamic Grids: Levels adapt to price movement.
- Proportional Grids: Steps change proportionally to the asset’s price.
- Expanding Grids: Steps increase as the price deviates.
- Constrained Grids: Trading occurs within a narrow range.
- Multi-level Grids: Divided into levels with different parameters.
- Bidirectional Grids: Simultaneous long and short positions.
Advanced indicators like market profiles add even more variability.
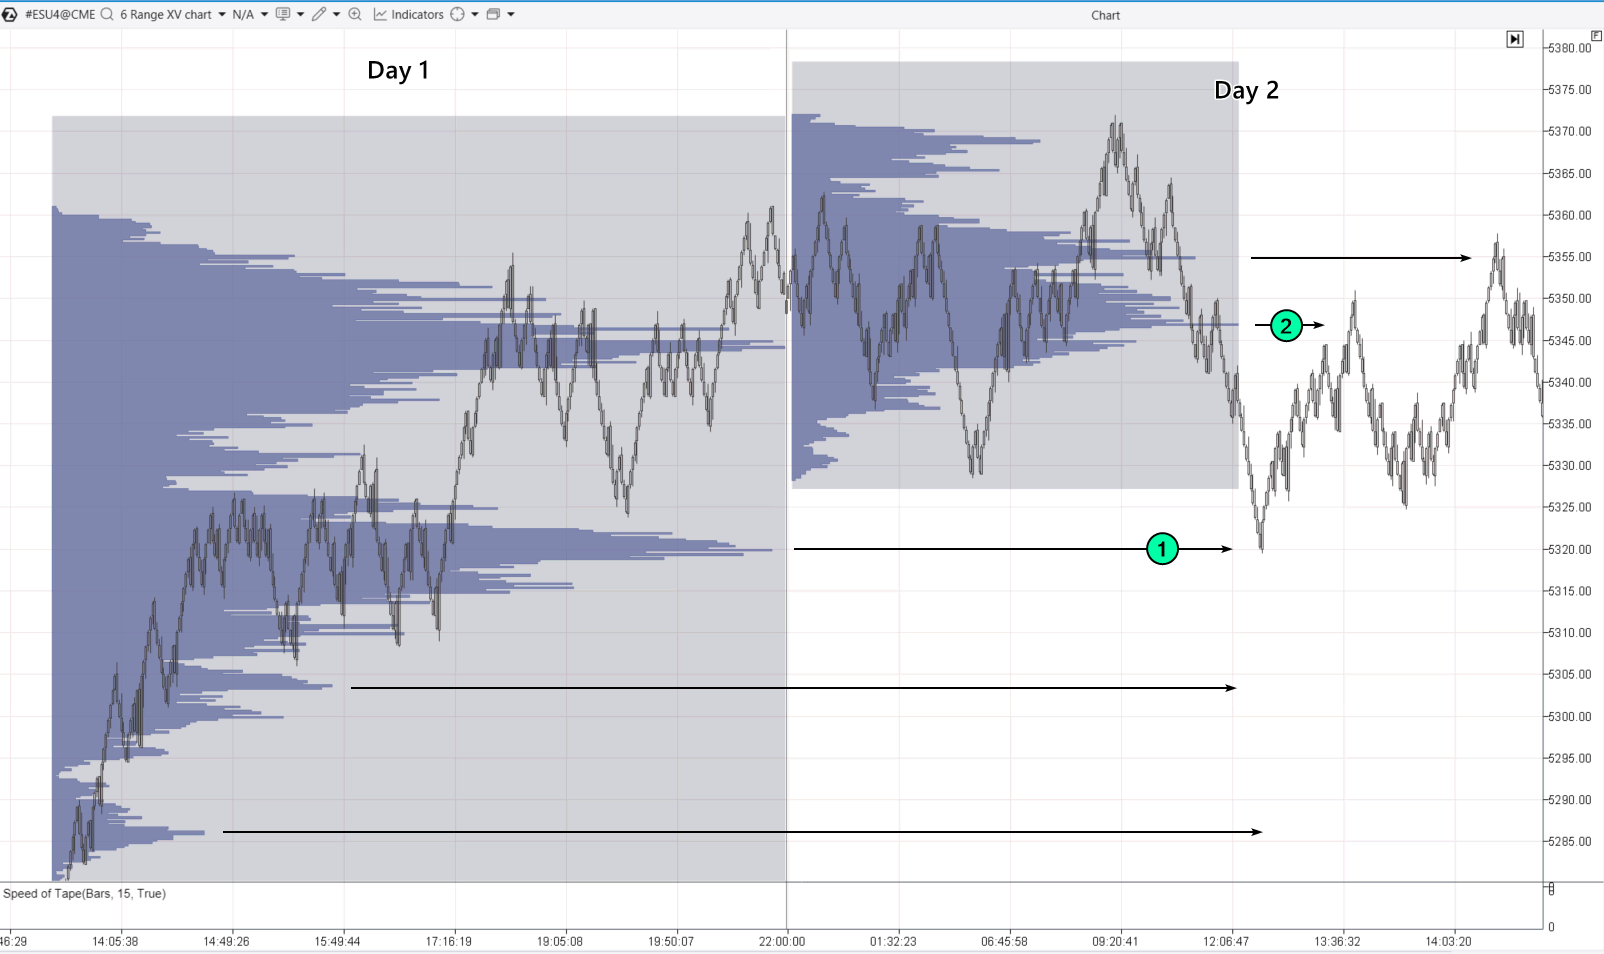
Suppose you start trading on day 2, and you notice that the market is calm and “bubbling” after yesterday’s trend. The price drops, and:
- You begin to build a buy grid based on the profile levels from the previous day.
- The first buy-limit order triggers at the first profile level.
- Then the price goes up without reaching the next grid levels.
- You close the position at a significant profile level above the current price.
Example of Classic Grid Trading
Let’s assume a trader believes that during the European session, before important news is released in the US market, the S&P 500 futures will remain calm, as market participants are likely waiting for the news.
Therefore, the trader decides to allow grid trading, adds the ATAS Standard Deviation Bands indicator, and follows these rules:
- Open (add to) positions when the price moves beyond the blue line.
- Close the position completely when the price touches the opposite red line.
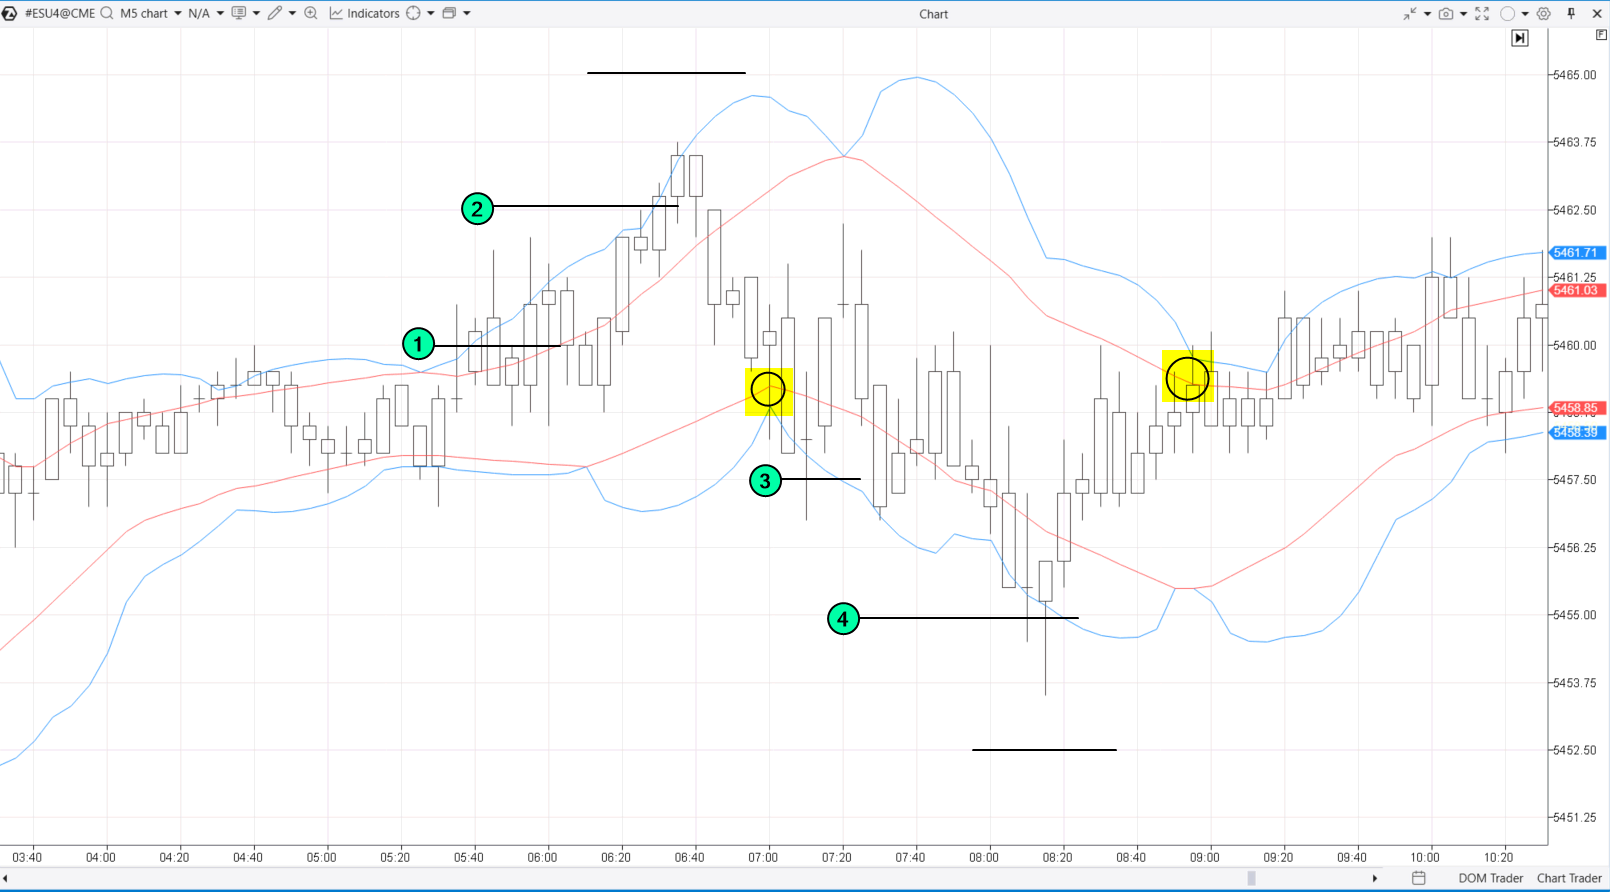
Here’s how it might look:
- (1) — Opened a short position,
- (2) — Added on the next grid level, the third order did not trigger, and the entire grid closed when the price touched the red line (highlighted in yellow). Then, a buy grid is constructed:
- (3) — Opened a long position,
- (4) — Added on the next grid level, the third buy order did not trigger, and the entire grid closed when the price touched the red line (highlighted in yellow).
Luck was on the trader’s side, allowing them to close both positions with a profit. However, the risks of grid trading are evident: the price might move in the “wrong” direction. More about the benefits, risks, and ways to mitigate them — further below.
Cryptocurrency Grid Trading Bots
Binance, like other cryptocurrency exchanges, offers users the functionality to set up grid trading using bots. To use the functionality: go to the Trading Bots page; click Create to set up the appropriate bot.
Binance, like other cryptocurrency exchanges, offers users the functionality to set up grid trading using bots. To use the functionality: go to the Trading Bots page; click Create to set up the appropriate bot.

What is a Spot Grid Trading Strategy?
A Spot Grid bot operates in the Binance section where actual coins are traded directly. In contrast, a Futures Grid bot engages in grid trading with futures, which are more speculative derivative instruments. With the Futures Grid, traders can profit from both price increases and decreases.
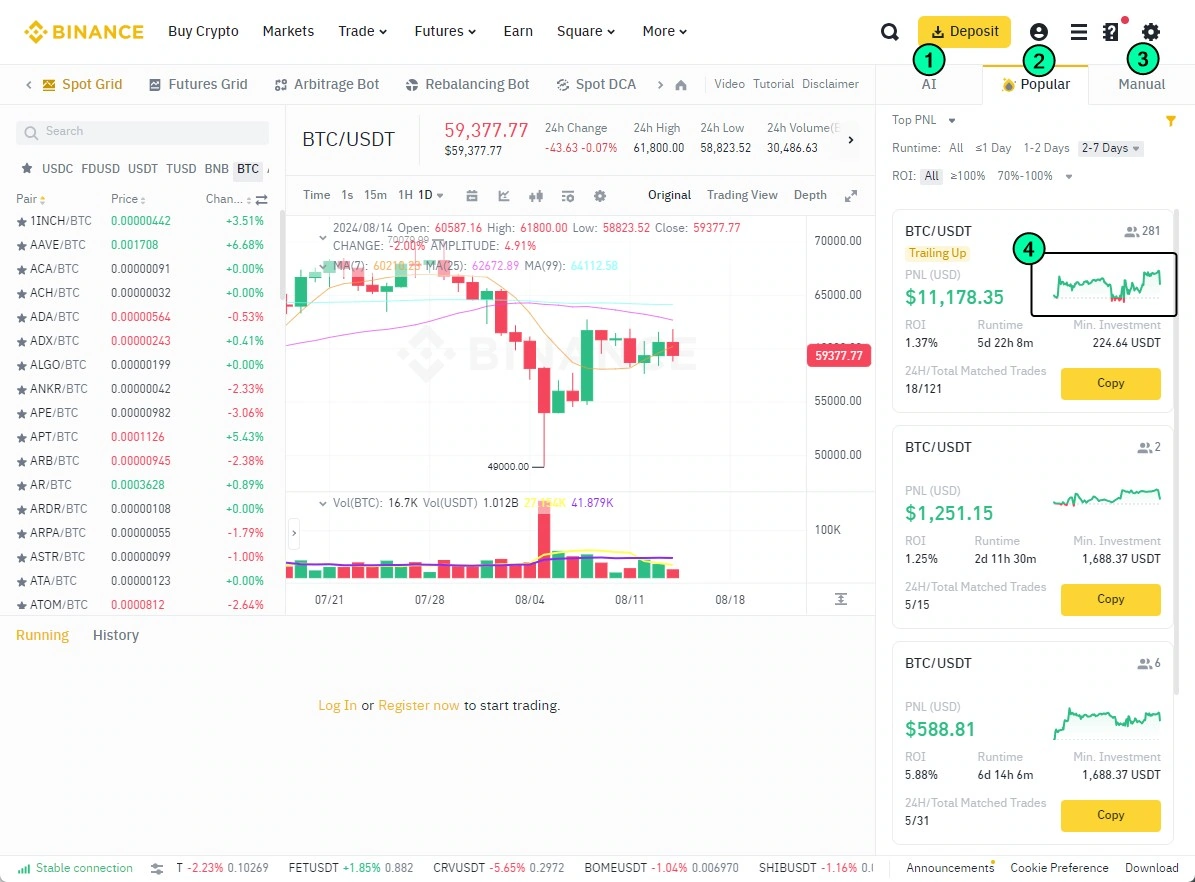
After clicking “Create,” select the type of crypto grid trading bot — options are presented on the right side of the chart:
- AI Bot: Artificial intelligence assesses recent volatility and automatically selects the grid step size.
- Popular: Here, you can copy profitable grid strategies to your account.
- Manual: Here, you can manually set the grid parameters. The system will calculate the amount needed to trade according to the specified parameters.
Pay attention to the equity curve (4) when grid trading — it is highly unstable. Ideally, you would want to see an upward zigzag line without significant drawdowns. In reality, even the best grid strategy (at the time of writing), with 281 followers, showed a negative result after a successful start.
TYPES OF GRID TRADING STRATEGIES
RANGE TRADING
Grid strategies are often used for trading during overnight sessions when markets are not volatile. Forex traders use this approach, trading fluctuations in European currencies when Europe is closed.
For such purposes, you can use the classic ADX indicator, which shows whether the market is trending. If the indicator manually drops below a certain threshold, grid trading is permitted.
Example: The essence of this approach is illustrated below on a gold futures market chart using the Deviation Bands indicator.
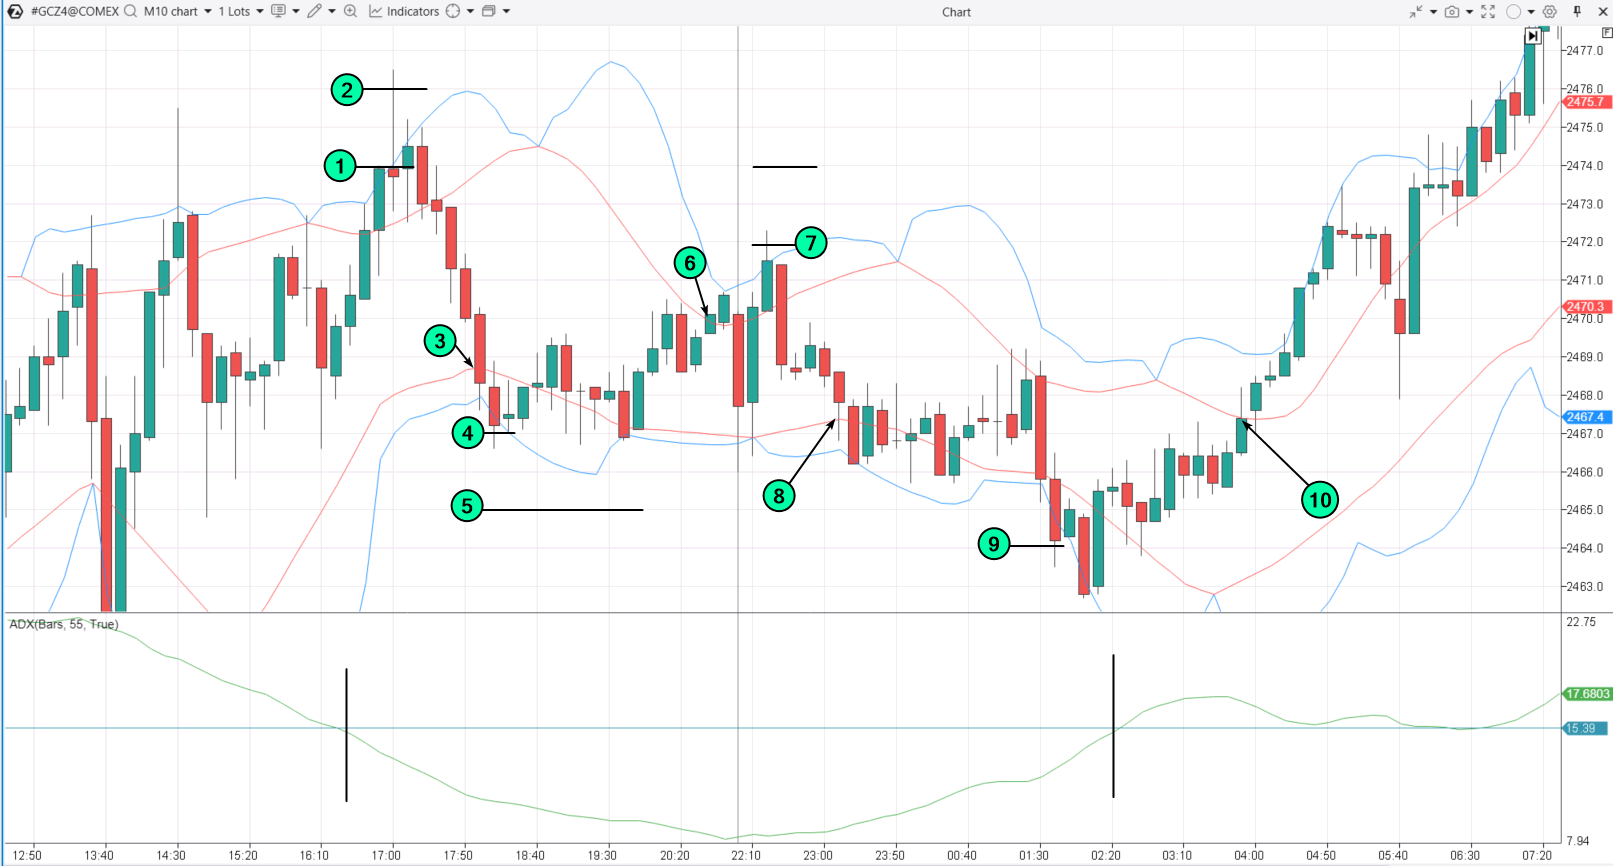
ADX dropped below the specified threshold, allowing trading.
- (1) — opened a short,
- (2) — added on the next grid step, the third order didn’t trigger, the entire grid closed upon touching the red line,
- (3). (4) — opened a long, the second order
- (5) didn’t trigger, the entire grid closed (6) upon touching the red line.
- (7) — opened a short, the second order didn’t trigger, the entire grid closed
- (8) upon touching the red line.
- (9) — opened a long, then ADX rose: closed the position immediately or waited for (10) the red line to be touched.
TREND TRADING
Expanding the previous chart, here’s how to trade a grid strategy when ADX rises (indicating a trending market):
- If the price rises above the Deviation zone, build a Buy-Stop grid. Close the position when it touches the opposite line (with a loss or profit).
- Similarly, apply the Sell-Stop grid when the price goes down.
An example is shown on the chart below:
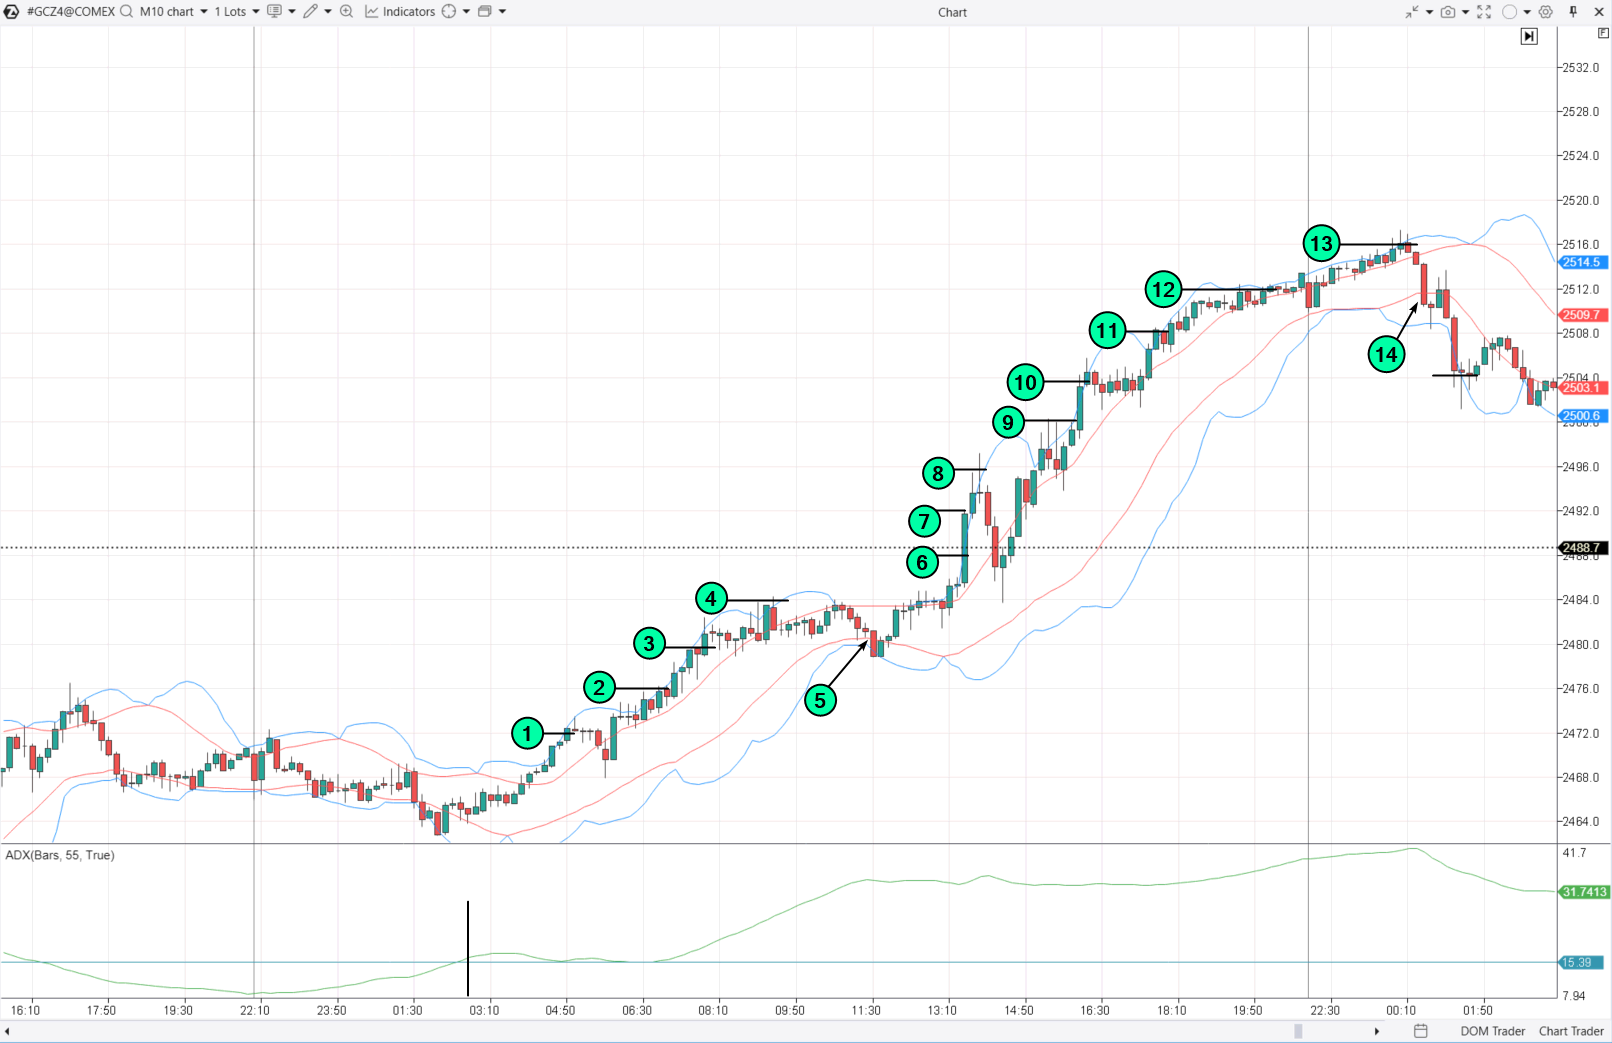
Then:
- From 1 to 4 — open long positions with Buy-Stop orders;
- 5 — close the entire long position; the first sell order will likely not trigger;
- From 6 to 13 — open long positions and continue adding;
- 14 — close the long position and switch to opening a short position with a Sell-Stop order, as the ADX indicates a strong trend.
Tip: To work with different market conditions — trend or flat — you can use non-standard ATAS chart types: range, renko, Volume, and others.
GRID TRADING WITH INDICATORS
In this case, indicator readings are used to determine levels for placing grid orders. For example, using ATAS Camarilla Pivots:
- If short positions are opened from resistance levels and long positions from support levels, and closed upon reaching the central pivot PP, then the grid trading strategy would look like this:
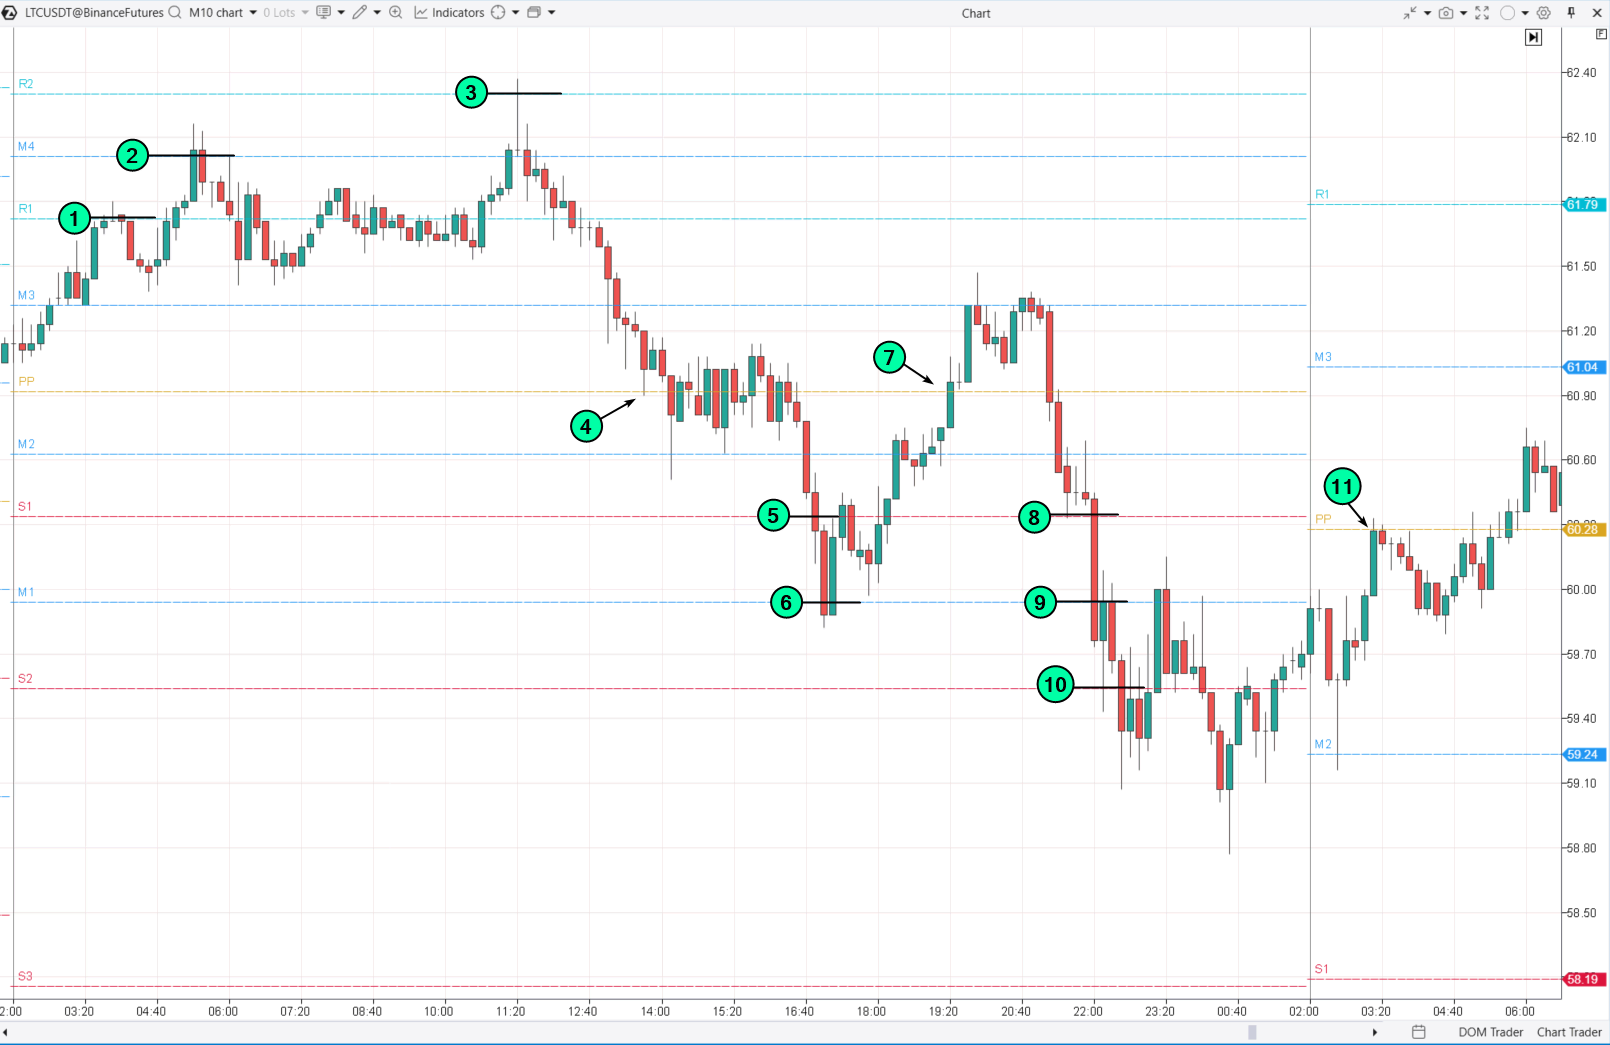
- (1)—(2)—(3): form a short position; (4): close the short position; (5)—(6): open a long position; (7): close the long position; (8)—(9)—(10): open a long position; (11): close the long position upon reaching the central pivot of the next day.Whether to trade using this method without stop-losses is a decision each trader must make independently.
ADVANTAGES AND DISADVANTAGES OF GRID TRADING
Advantages:
- Flexibility and Customization: Grid strategies can be adapted to any rules, allowing traders to test their ideas in a grid trading format.
- Versatility: The approach applies to any timeframes and various markets, including currencies, stocks, and commodities, making it appealing to traders with diverse interests.
- Ease of Automation: Grid strategies are relatively simple to program and can be implemented as trading robots, reducing the need for constant monitoring and manual intervention. Automation also allows for backtesting the grid strategy on historical data.
Disadvantages:
- Loss Risks: A primitive arithmetic approach may not account for complex market structures, leading to significant losses, especially during sharp market movements.
- Potential Complexity in Refinement: Adding extra rules and filters to improve efficiency requires deeper analysis and may complicate the strategy, increasing time for setup and management.
- Psychological Pressure: Managing multiple open positions can create significant psychological stress, particularly in high-volatility conditions.
Different capital management methods listed below can be used in grid trading to mitigate its disadvantages.
- Equal Position Sizing: Each grid position is opened with the same volume, regardless of level or the current price of the asset.
- Dynamic Position Sizing: The position volume varies depending on the price level or other factors like volatility or risk. For instance, volume can increase at lower grid levels and decrease at higher ones.
- Martingale: The position volume increases after each losing trade to compensate for previous losses when the price returns.
- Anti-Martingale: The position volume decreases as losses accumulate, helping to reduce risks in a prolonged trend. Learn more about this method in the article: Should You Use Anti-Martingale?
- Partial Close: The position is closed in parts upon reaching certain profit levels or when the price moves to the next grid level.
- Full Close: The position is closed entirely upon reaching the target profit level or when certain conditions, such as the price moving out of range, are met.
- Rebalancing: The volumes of open positions are periodically reviewed and adjusted based on changing market conditions or the capital management strategy.
BT
#GridTrading, #ForexTrading, #TradingBots, #CryptoTrading, #SpotGrid, #FuturesGrid, #TradingStrategies, #MarketIndicators, #ADX, #BuyStop, #SellStop, #RiskManagement, #AutomatedTrading, #TradingTools, #MarketAnalysis
![]()

