Bear Trap — is a situation on the stock market that can mislead inattentive traders. It consists of two movements:
- First, the price of the asset falls, creating the illusion of the beginning of a downward trend. Traders expecting further declines rush to sell the asset, turning into “bears.”
- However, the price soon starts to rise. This usually happens very quickly, leaving those traders trapped in losses.
In this article, we will take a detailed look at how a bear trap works and how to avoid falling into it.
Bear Trap in Trading — is a false downward movement that provokes market participants (usually impulsive and inexperienced) to open short positions.
A bear trap in stock trading arises due to the combination of the following factors:
- Mass sentiment of market participants. The desire to profit from falling prices, fear of losses, and impulsive actions by traders lead them to sell assets. These emotionally driven trading decisions often turn out to be unprofitable.
- Manipulation by large players. It is possible that market makers or large investors may intentionally drive prices down to trigger mass sales among retail traders, and then buy the asset at a more favorable price.
- Technical factors. False breakdowns of support levels or misleading indicator signals deceive traders into believing that the downward trend will continue.
- Fundamental factors. Short-term panic caused by news or rumors before their publication can lead to temporary price drops, after which the price quickly recovers.
EXAMPLES OF A BEAR TRAP
Bear traps on the stock market occur quite frequently, both intraday and on higher timeframes.
Example #1 of a bear trap in the E-mini S&P 500 futures market on a 3-minute timeframe:
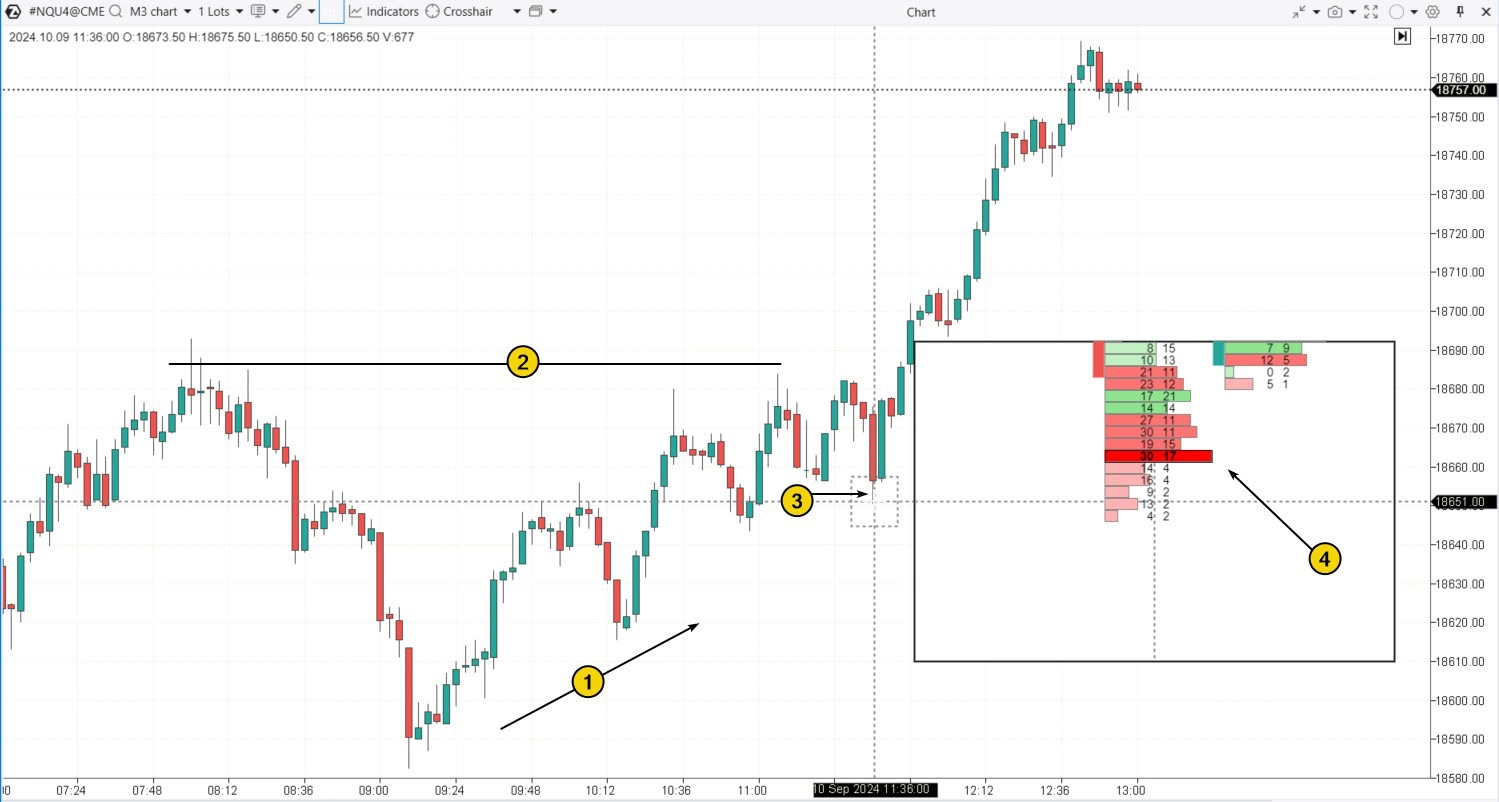
Starting from 09:00, the market was dominated by positive sentiment (1), with the price moving upward, forming higher highs and lows throughout the day.
However, upon approaching the previous resistance level (2), the upward momentum slowed down. At 11:36, the price dropped below the previous (3) local low.
It’s possible that market participants began actively selling contracts, anticipating a trend reversal to the downside. Bright red clusters on the footprint chart (4) clearly indicate executed market sales.
However, the price then reversed upward and broke through the previous resistance, trapping those who believed the rally was over or who had exited their long positions due to stop-losses.
The losses fixed by the bears caught in the trap helped break through the resistance level (2), acting as “fuel” for the upward breakout.
Example #2. Bear trap crypto — a bear trap on the Bitcoin market.
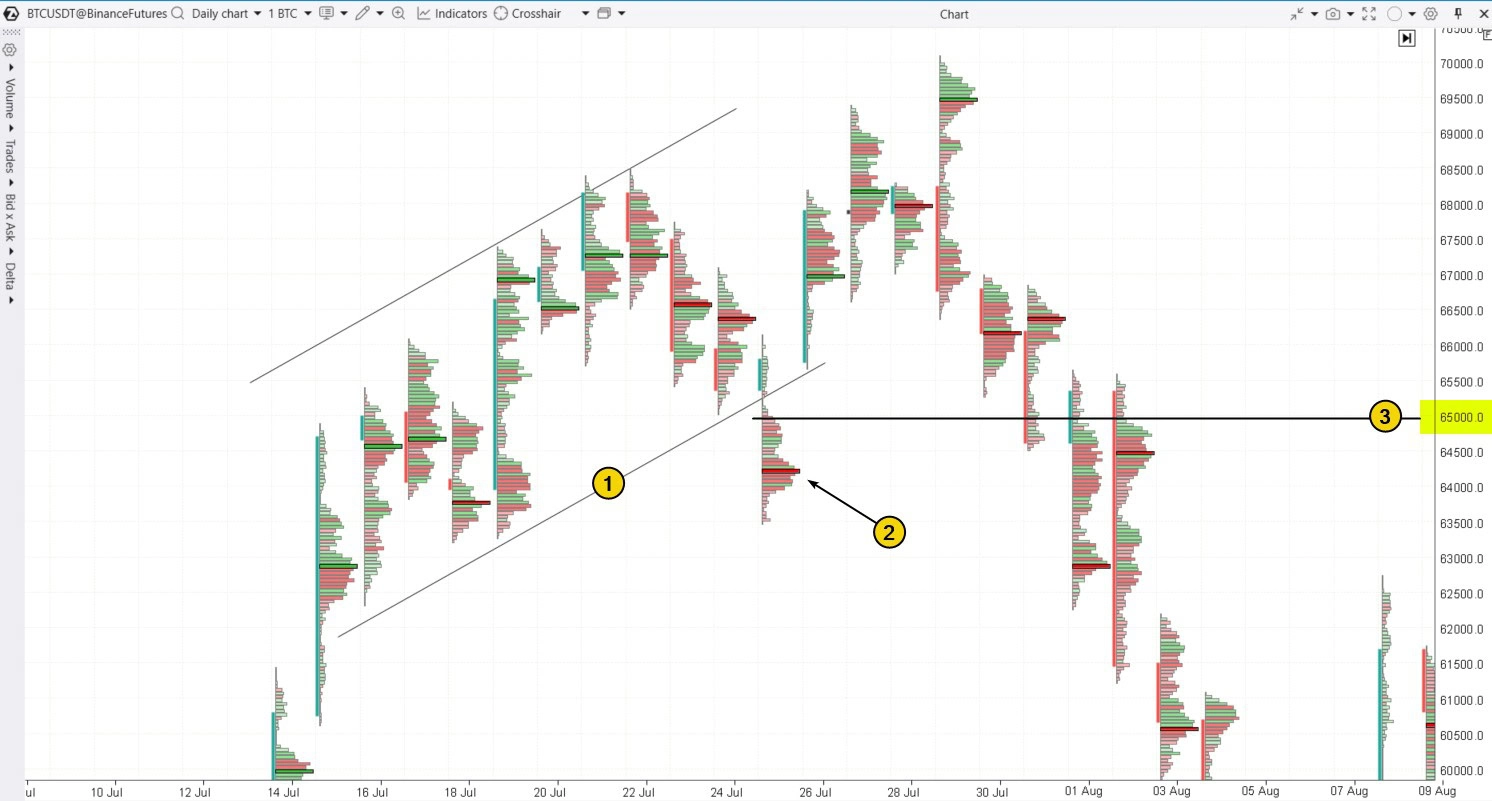
This is a daily chart of BTC/USDT from Binance Futures, showing a rally within an ascending channel (1).
However, the price then began to decline, dropping below the psychological level of $65k and clearly breaking the lower boundary of the channel. Market participants started to fear that the upward trend was over, and the downward momentum might intensify. They expressed these concerns through market sales, visible in the bright red cluster (2). The bulge in the profile indicates some balance: meaning that the influx of market sales was met by enough opposing Buy-limit orders, likely from professional participants.
Nevertheless, the candle closed near the highs, significantly above the bright red cluster, leaving the sellers in a vulnerable position, and eventually surpassed the previous high, much to their disappointment.
By the way, the green clusters at the top on July 29 are signs of a bull trap, into which buyers fell during the breakout of the July 27 high.
HOW TO IDENTIFY A BEAR TRAP ON A CHART?
A bear trap on a chart is typically identified through a breakdown of a support level. Usually, it manifests as follows:
- Entry into the bear trap. A brief decline pushes the price below a clearly visible trendline, previous low, or psychological price level. This provokes market participants to open short positions (or to close long positions — manually or via stop-losses).
- Trap closure. Instead of continuing the downward movement, there is a sudden upward reversal. This usually happens sharply, reducing the chances for bears to exit without losses.
Using advanced volume analysis tools, such as market profile indicators, cluster charts, and other methods, allows traders to more confidently confirm the formation of bear traps.
WHEN DO BEAR TRAPS OCCUR IN TRADING?
An important element in trading bear traps is analyzing the context. The most suitable moments for the formation of bear traps are:
- Price breaking out of a noticeable range. In this case, those who mistakenly believe the bearish breakout of the range is genuine fall into the trap.
- False break of a psychological support level. Traders may assume that if the price drops below $100, it will continue to fall to $90 or, at least, to $95.
- Bear trap in an uptrend. It is aimed at causing doubt among some traders regarding the further rise in price, prompting them to sell their positions, which are often bought by more experienced and patient professionals.
- Fundamental events. Often, volatility spikes related to the release of important news create favorable conditions for forming traps. At such times, traders find it difficult to objectively assess the validity of rumors and the impact of new information, which is accompanied by active price movement.
Pattern #1. Bear Trap with a Gap
The example below shows how a wide gap closes the bear trap on the cluster chart of AAPL stocks on a daily timeframe.
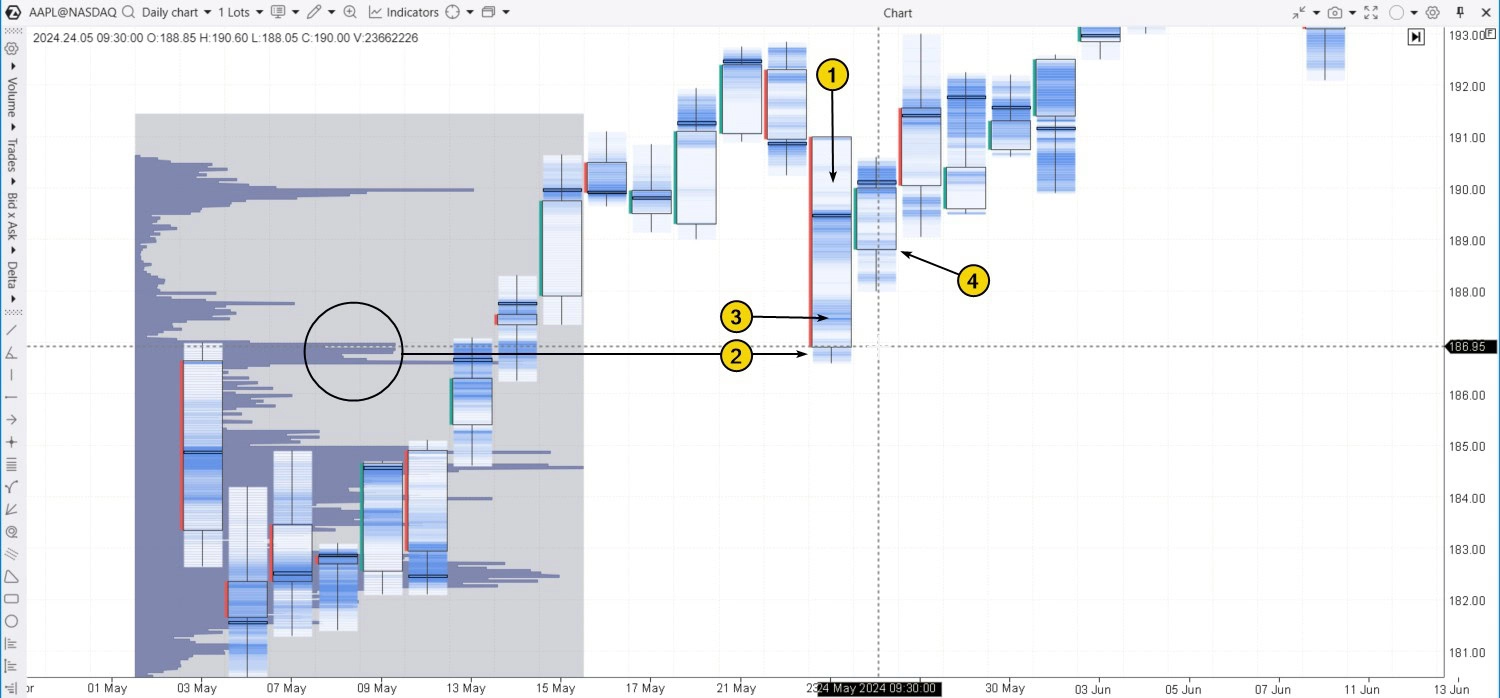
On May 23, 2024, Apple (AAPL) shares dropped sharply (1).
Traders using volume analysis noticed that the price drop led to a test of the profile bulge (2).
But if this important support was missed, emotions might have led one to believe that the stock was entering a downtrend, making the decision to sell seem justified. The activity marked with the number (3) is likely related to market sales by traders motivated by this.
In fact, after testing the profile bulge, the next day’s trading opened with a bullish gap, trapping the sellers who opened short positions near the May 23 low.
Pattern #2. False Breakout from a Range
When the price of a financial asset moves within a range, it creates a vulnerable situation for trend traders, who risk making mistakes if they interpret price movement as a breakout in one direction.
Example on the Litecoin chart, where the added Delta indicator helps confirm the activity of market sales with spikes of negative values.
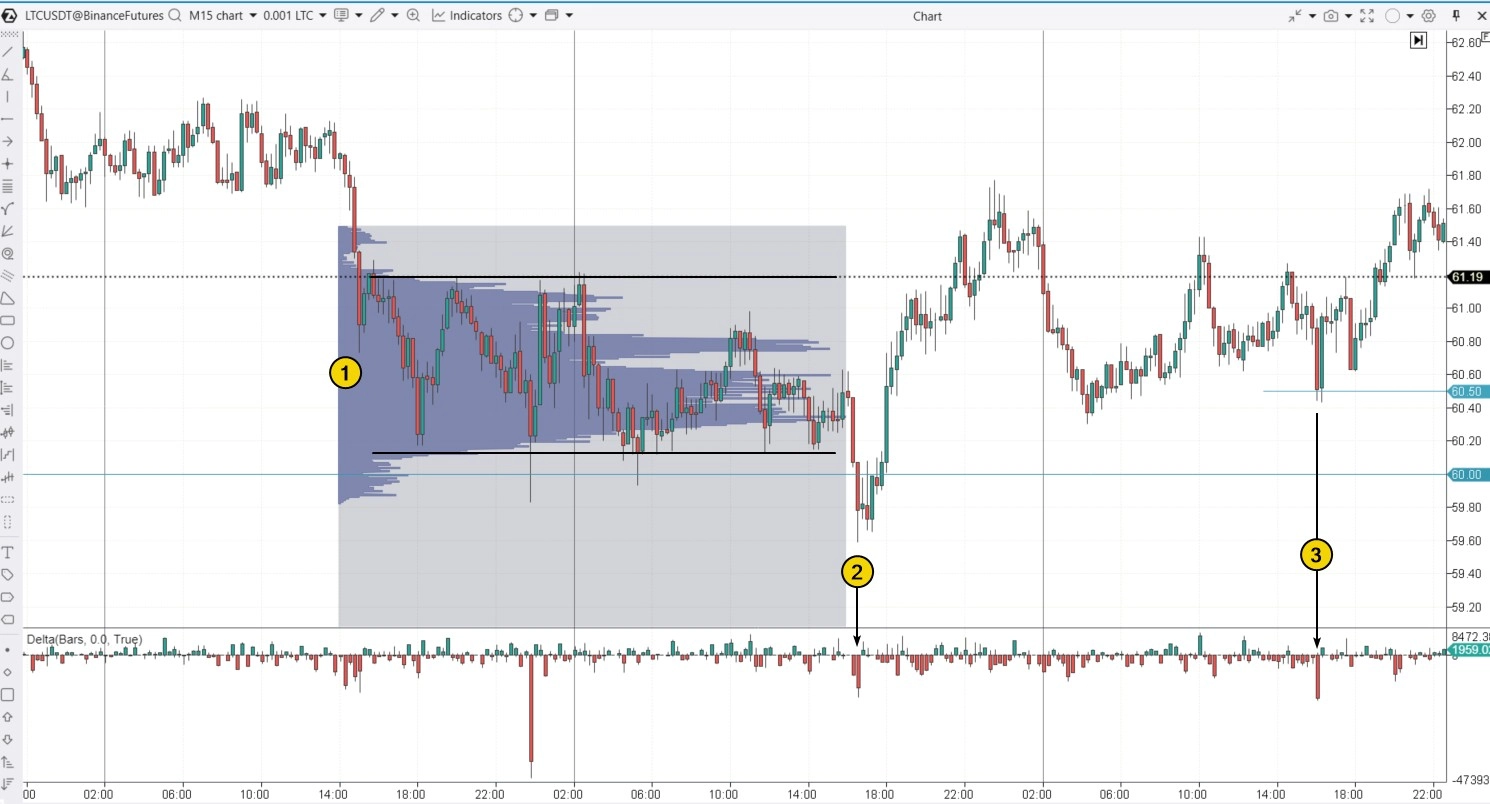
(1) The price moves within a range, rarely breaking out of the boundaries marked by black lines. Traders remain in anticipation.
(2) The price drops below the psychological level of $60 for Litecoin. This not only triggers stop-losses for buyers “hidden” behind this level but also entices emotional traders, tired of waiting, to open short positions.
However, the downward trend does not develop, and instead, the price returns to the range on a wide bullish candle, trapping the bears.
(3) Another decline, which can be called a bear trap, looks more like a “stop run” below $60.50. For the bears to fall into the trap, the price needs to pause at the lower part of the pattern.
Pattern #3. Bear Trap at the End of Accumulation
Accumulation — is a term from Wyckoff’s Methodology.
It refers to the stage (marked in purple below) when the market is depressed, and large players, having the advantage, are in the process of accumulating assets at low prices, preparing for the next stage of price increases. Bear traps during the final accumulation stage are called Terminal Shakeout by Wyckoff.
Example. On the MSFT chart.
2022 was a difficult year for the stock market due to rising inflation, fears of recession, and other factors. This reflects the direction of the 100-period EMA.
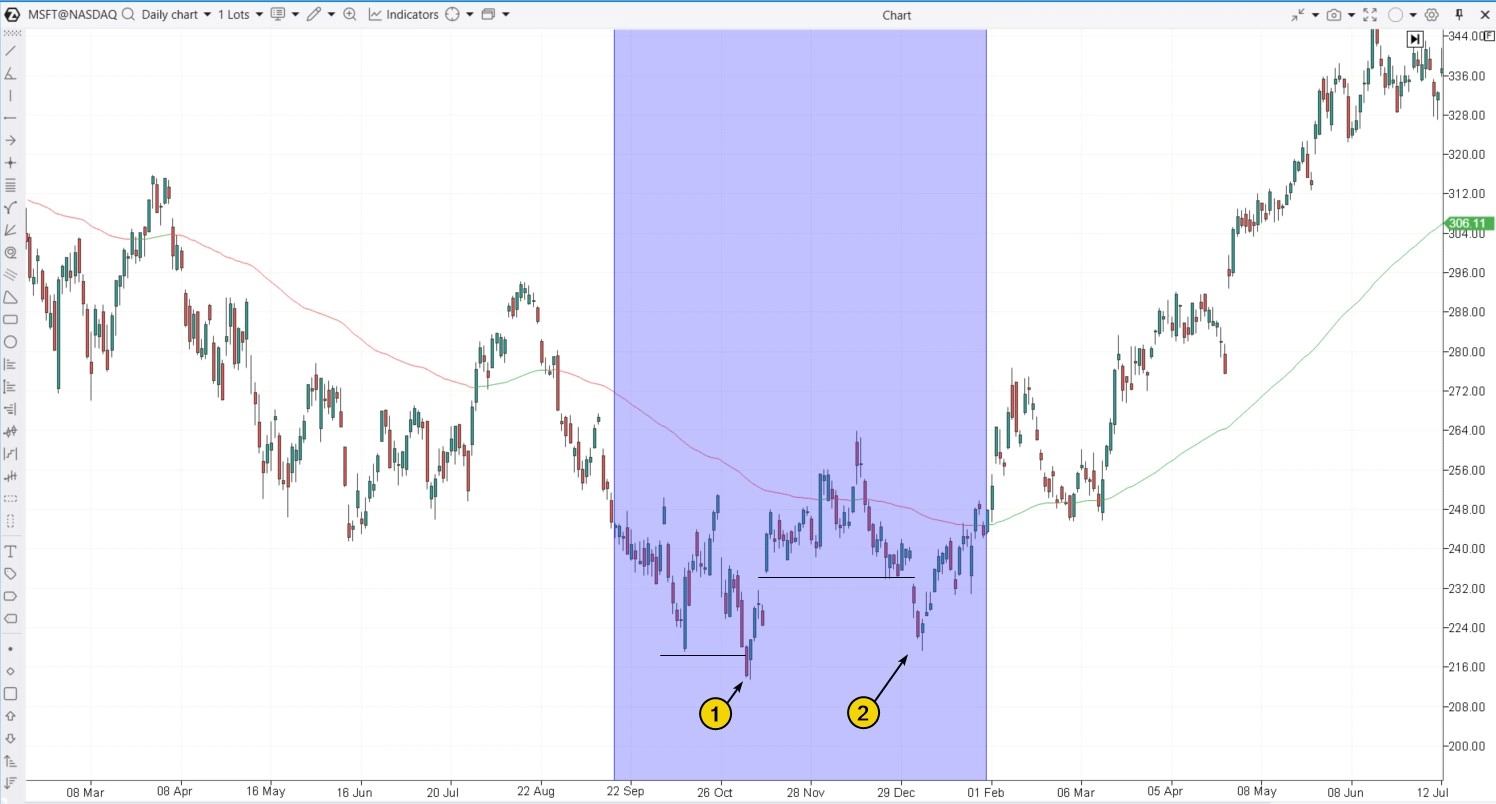
However, in December 2022, the situation more or less stabilized. One of the signs was a bear trap (1): the price fell below the previous low but almost immediately recovered — this can be interpreted as exhaustion of selling pressure. In the context of the current bear trend, the price was more likely to develop a downward momentum.
In December, the stock market discussed that the actions of the Federal Reserve could prevent a recession and bring inflation under control. This helped MSFT secure above the bullish gap around the $233 level.
But what happened in the early days of 2023? A sharp price drop (3), which was facilitated by reduced market liquidity during the holiday season. This was a bear trap when the market was ready to enter a growth phase in 2023, supported by news of decreasing inflation and discussions related to AI.
Pattern #4. Bear Trap in an Uptrend
In a market that is in a growth phase, bear traps facilitate the transfer of contracts from traders expecting a reversal to those betting on the continuation of the bullish trend.
Example. This is a chart of a cryptocurrency asset, which was experiencing a surge of excitement at the time of writing.
The green line, noticeable on the chart in the lower right corner — a moving average, indicating the development of an uptrend where the price broke through the psychological level of 0.19000 upwards.
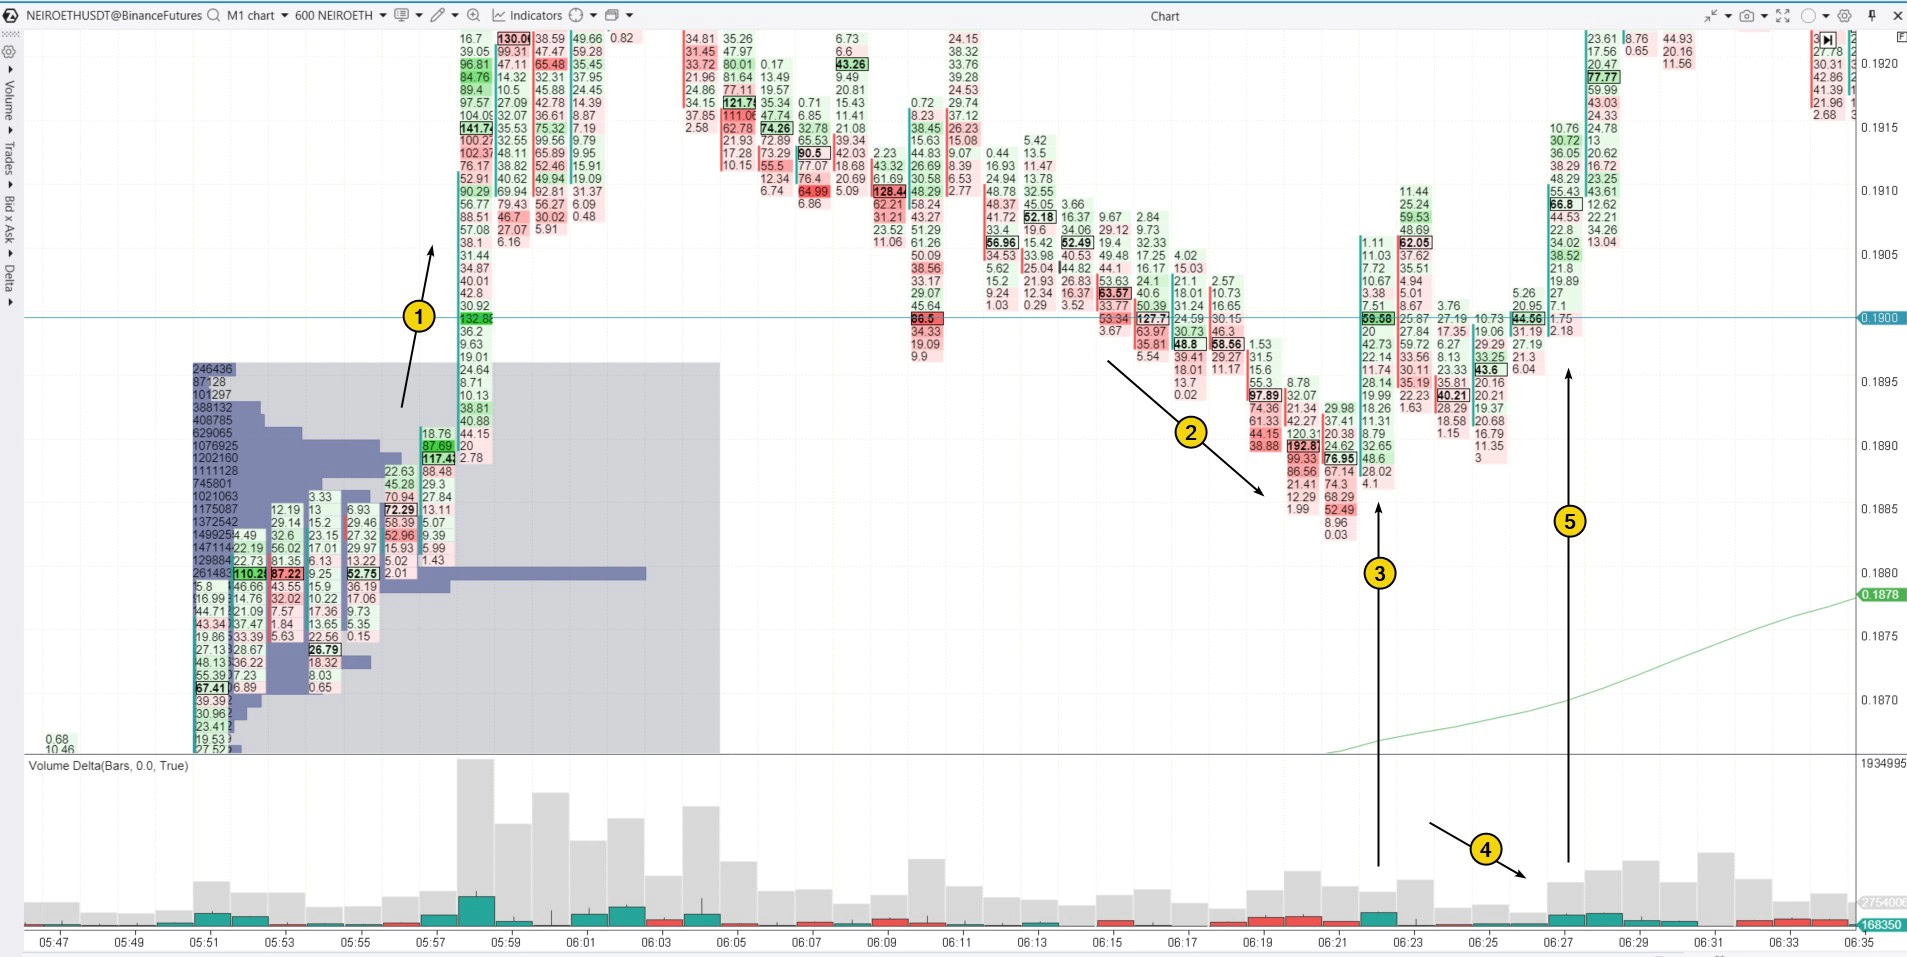
During the correction from the overbought zone, the price dropped again (2) below the 0.19000 level. As seen from the delta and red clusters, sellers were active:
- Some believed that the “pump” was over and the “dump” was beginning;
- Others were closing long positions (for example, those who bought on the profile bulge near the breakeven point before the 0.19 level breakdown could have closed their long positions).
Either way, the situation has the characteristics of a bear trap, especially considering how sharply it snapped shut (3). The subsequent price drop on low volumes (4) indicated the exhaustion of selling pressure, which was confirmed by the next bullish impulse (5).
Pattern #5. Bear Trap Amid News
September 11, 2024, was a significant day due to the publication of Consumer Price Index data. Inflation figures were given special attention ahead of the anticipated Federal Reserve rate cuts.
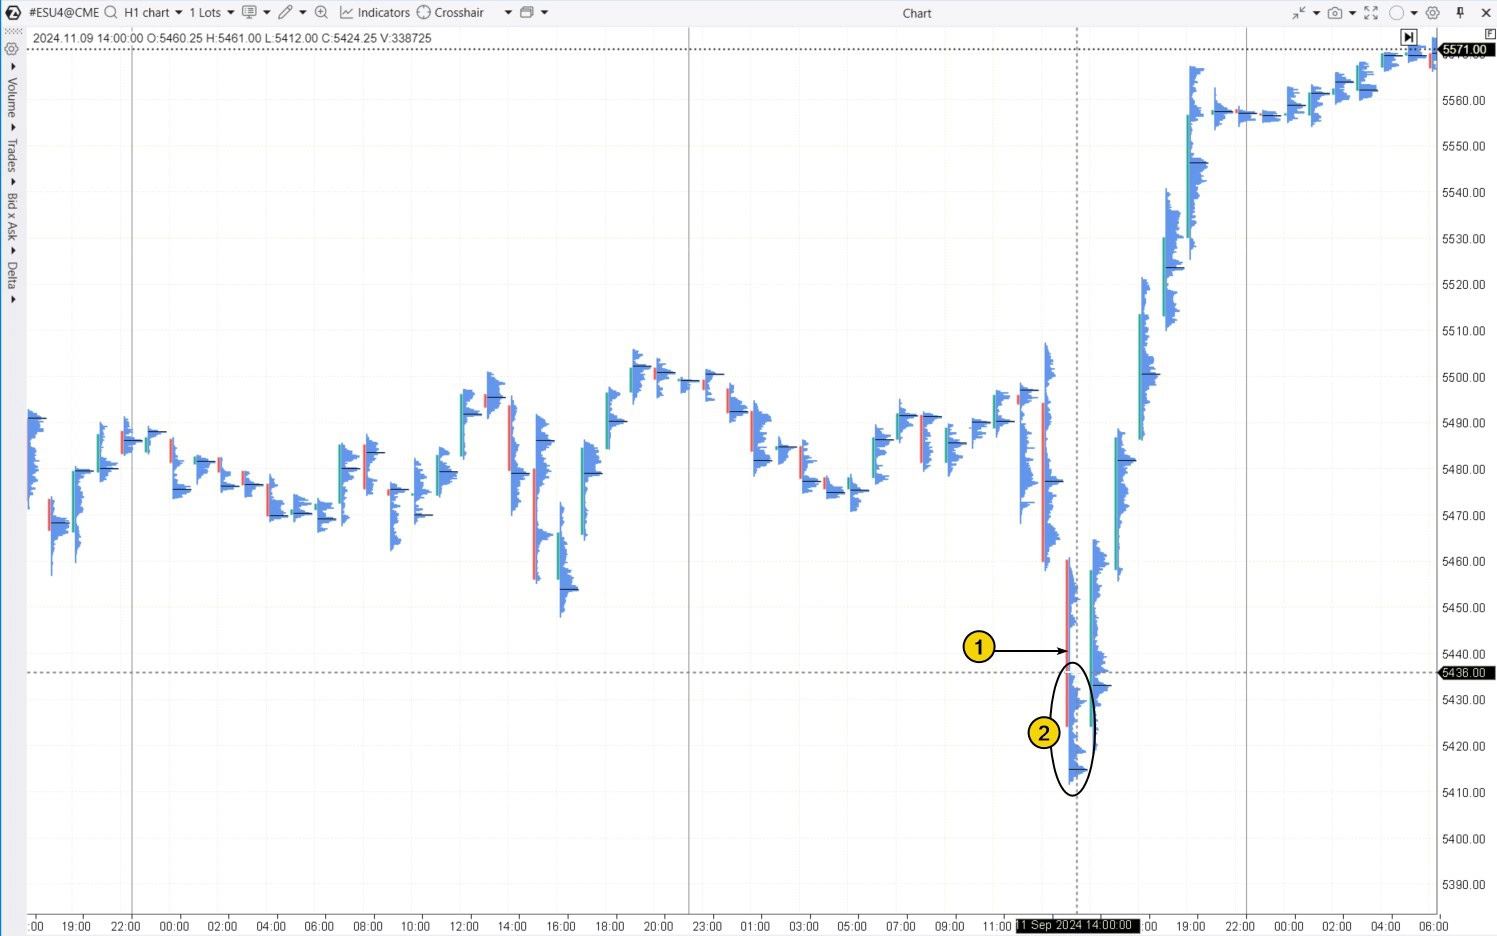
Before September 11, the price was in the range of 5450-5500, and traders were closely watching for news releases.
But what happened just before the publication:
The price started to fall sharply (1). The thin profile indicated total dominance by sellers.
The sharp price decline attracted new sellers (2), fearing that the CPI release would drive the price even lower.
However, the opposite happened. Inflation rose slightly above expectations, but only marginally. The market’s reaction was a powerful surge in prices, trapping the unlucky bears.
Pattern #6. Bear Trap Near a Psychological Level
The cryptocurrency market is characterized not only by volatility but also by traders’ emotional reactions. Traps near round levels are visible on the daily chart of almost any crypto asset.
Example. Daily footprint of Litecoin with the added Round Numbers indicator.
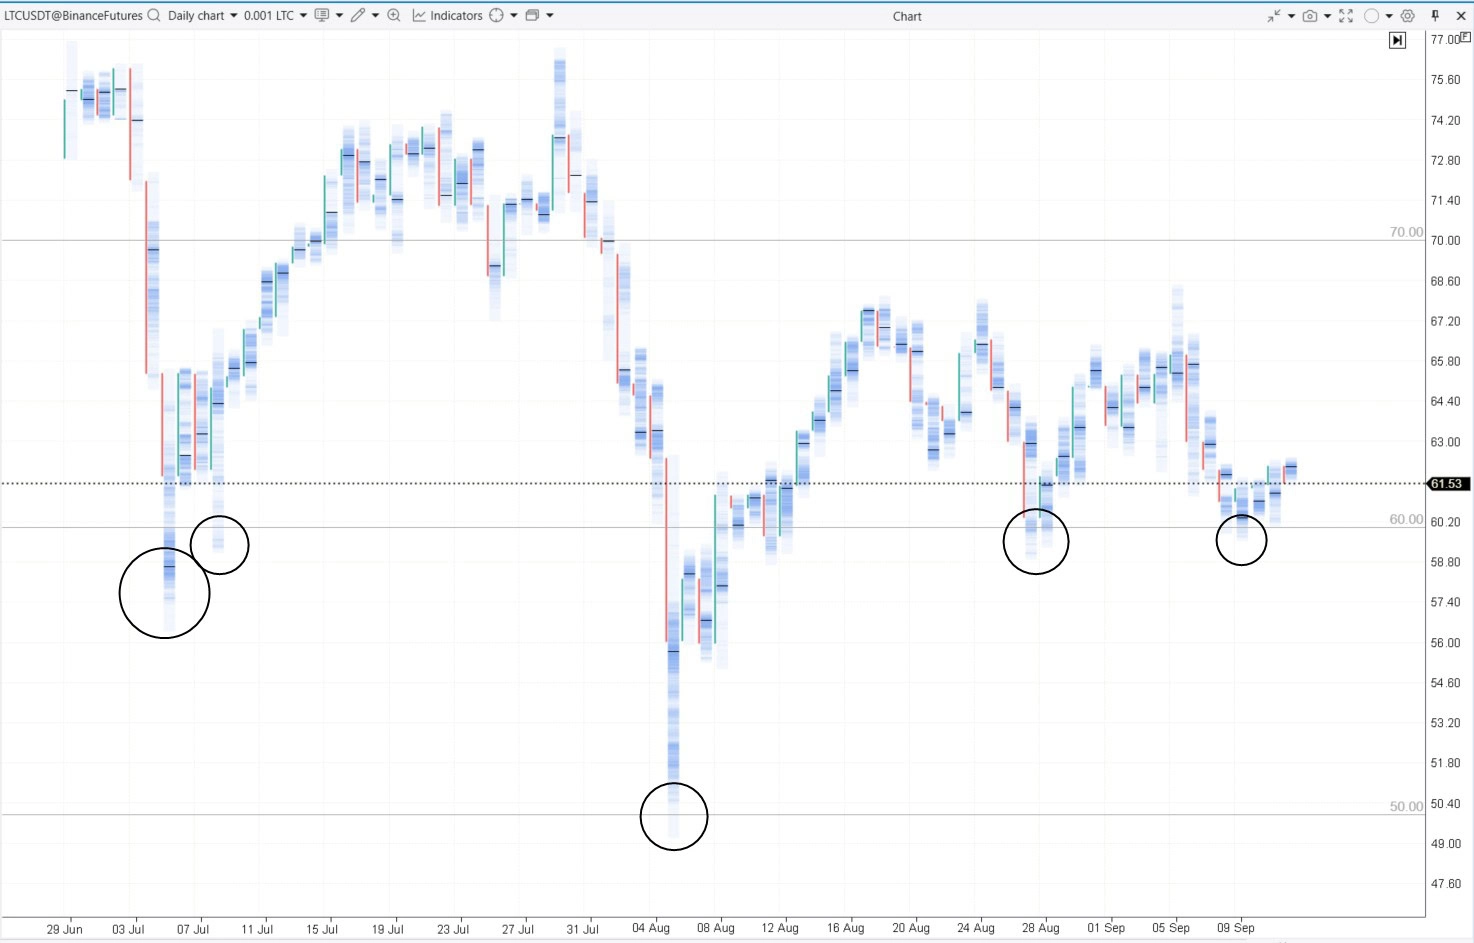
Circles group together patterns that exhibit signs of bear traps. The formation process is similar to what was described in previous examples.
BEAR TRAP TRADING STRATEGIES
A bear trap is based on the principle of “one’s profit — another’s loss.” It forces less experienced traders to sell assets on a false decline, creating opportunities for more experienced and informed market participants to extract profit.
Therefore, to succeed in bear trap trading, it is crucial to understand whose losses generate the profits and how they are formed.
STRATEGY #1. BUY ABOVE THE TRAP BULGE
Suppose you identified a critical support level, where a false breakdown could lead to the formation of a bear trap in trading. What’s next? Let’s explore this more aggressive approach using a chart.
Example. Throughout the day, the price held above (1), forming higher highs, but during the volatile U.S. session, it dropped lower. This could have triggered selling pressure, leading to the formation of a bear trap.
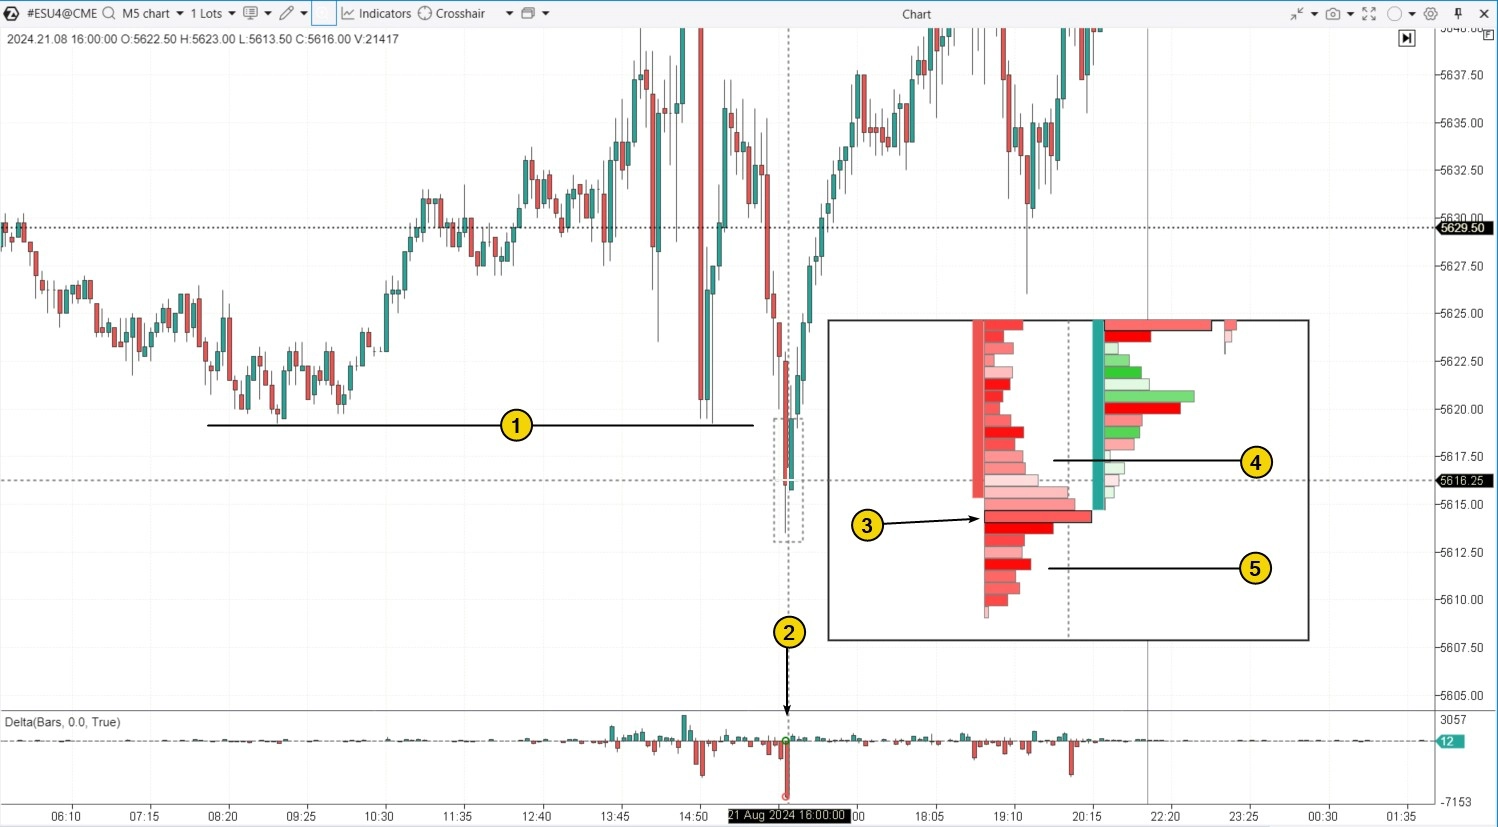
Additional factors provide more reasons to assume the formation of a bear trap:
- a spike in negative delta (2);
- a bulge on the profile (3), colored red (evidence of mass market sales);
- the price’s position above this bulge. If mass market sales represented real pressure, the price would hardly remain above the wide red clusters.
In this case, you can consider opening a long position above the bulge, for example, at the (4) level. And set a stop-loss below it, for example, around level (5).
The downside of this strategy is that after a pause, selling pressure may resume.
STRATEGY #2. BUYING ON TRAP CLOSURE
To implement this more conservative strategy, you need to wait for buyer activity that “closes” the bear trap.
Example. This is a Bitcoin price chart of the Volume type. It visually shows the delta percentage in the overall candle volume.
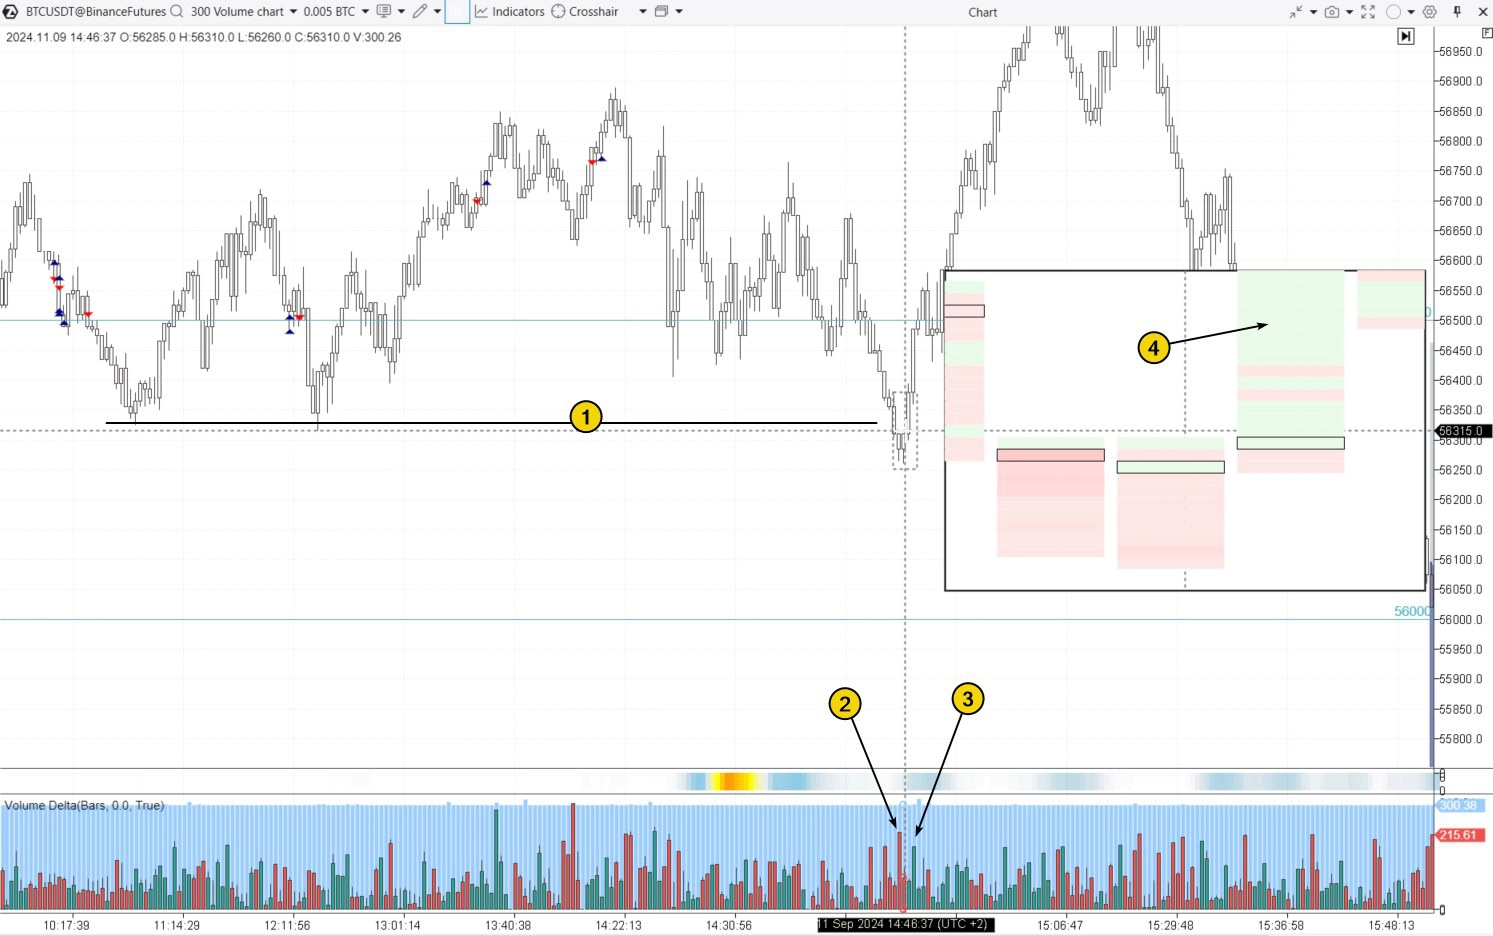
In the discussed example, the price stayed above support (1) for a long time, but then dropped below it.
A spike in negative delta (2) confirms seller activity, while the lack of continued downward momentum suggests the formation of a bear trap.
Active buyers begin to step in, closing the trap — this supports the argument for opening long positions.
There could be spikes in positive delta (3) or clusters of green, indicating an increase in demand for the asset.
In this case, it may be more prudent to open a position, but if you enter it at the right time, the position is likely to quickly move into profit.
HOW TO AVOID FALLING INTO A BEAR TRAP
It is important to avoid bear traps to prevent losses from false breakouts, where the price suddenly reverses upward after a brief drop. Traders caught in such traps might sell at the lows and experience psychological difficulties related to losing confidence in their strategy.
There is no guaranteed method to fully protect against losses in trading on the stock market, but in some cases, it is useful to watch the market context, place corrective stop-loss orders, and not risk too much capital in one trade.
Method #1. Context Analysis
There are several indicator options left, with the goal for traders to analyze the support and resistance levels to get a clearer picture and reduce the risk of a false breakout or the development of a dangerous bear trap.
Use Footprint and Other Volume Analysis Tools
In the market, volume is an important indicator of supply and demand. Get additional signals for levels and spikes in activity, displayed in the delta and on footprint charts.
Method #3. Become a Market Psychologist
Besides the fact that many market traders often act under the influence of fear and greed, it is possible to understand how not to succumb to impulses in such situations. Traders who follow a plan and others in the market who react to false breakouts of support levels are better equipped to make decisions calmly.
BT
#BearTrap, #Trading, #Futures, #Cryptocurrency, #MarketAnalysis, #Footprint, #VolumeAnalysis, #Delta, #TraderTraps, #TechnicalAnalysis, #MarketPsychology, #TradingStrategies, #FalseBreakout, #MarketPatterns, #BuyAboveBulge, #CryptocurrencyMarket, #VolumeAnalysis, #SupportResistance, #ContextAnalysis, #TradingPsychology, #BearTrend, #ChartAnalysis, #DailyCharts, #StockTrading, #FuturesTrading, #TradingMethods, #TradingSignals, #BullTrend, #Forex, #MarketTools, #FalseBreakout, #RoundNumbers, #CPI, #ConsumerPriceIndex, #MarketStrategies, #FederalReserve, #Volatility, #Inflation, #FinancialMarkets, #StockMarketTrading, #TrendTrading, #MarketForecast
![]()


