⇒ Warning. Any strategy does not guarantee profit on every trade. Strategy is an algorithm of actions. Any algorithm is a systematic work. Success in trading is to adhere to systematic work.
The “Megaphone” pattern typically visualizes when the price touches the expanding triangle’s boundaries at least five times—three touches on one boundary and two on the other. However, in practice, the number of touches is not necessarily limited to this sequence.
Example: Two “Megaphone” patterns on the 5-minute gold futures chart:
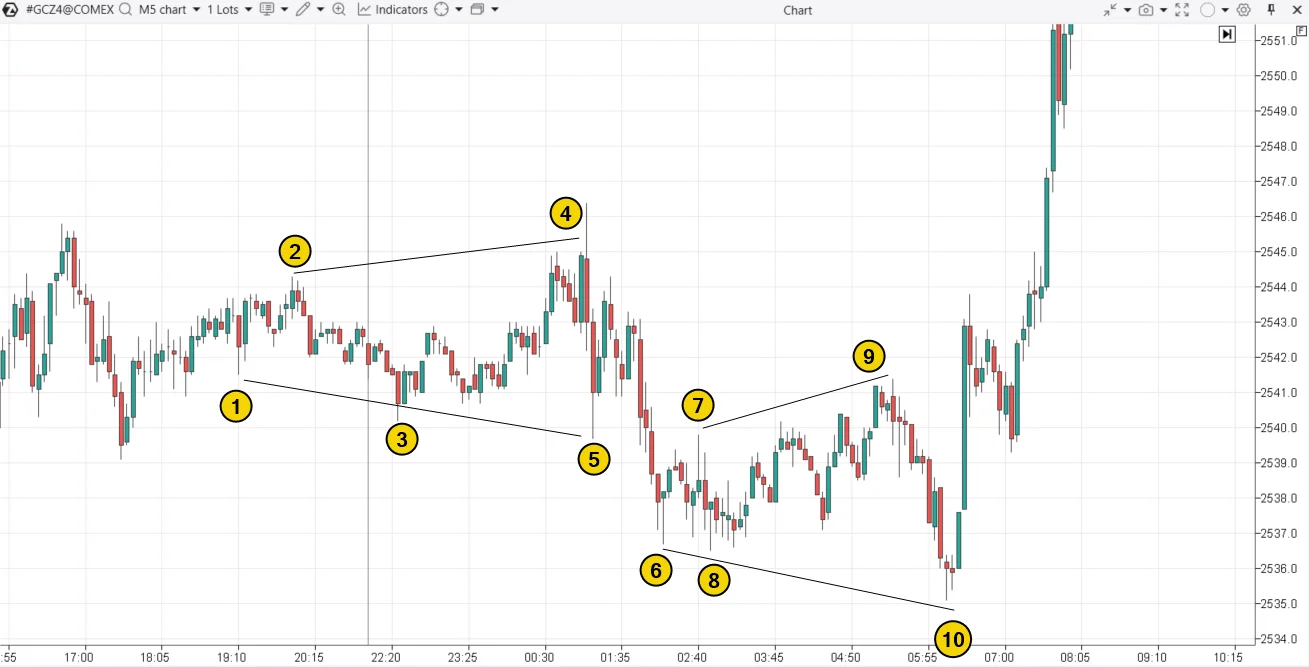
A common feature of all “Megaphone” patterns is increased volatility.
The first instance on the chart 1—2—3—4—5 formed when the market was “waking up” during the Asian session.
The second instance 6—7—8—9—10 occurred when market activity increased before the release of significant economic news. Perhaps traders were trying to position themselves advantageously.
What Does the “Megaphone” Pattern Mean in Trading?
When interpreting the “Megaphone” pattern, traders need to consider a combination of various factors, which may manifest in different proportions in each case. Among these factors:
- Increasing Volatility: The price moves with an expanding range, which could equally indicate an active struggle between bulls and bears for market control, especially amidst economic news releases.
- Uncertainty About the Future: The gradual increase in the amplitude of fluctuations is a sign of uncertainty among market participants, making the pattern typical for situations where the market cannot determine the trend direction.
- Manipulative Nature: In some cases, the “Megaphone” pattern may result from manipulative actions by large players trying to create the impression of a volatile market to lure traders into false breakouts. Consequently, after several boundary expansions and false signals, large players may exploit the market liquidity to form their positions in the desired direction when most small participants end up in losing positions.
Example of Manipulation: Point 10 on the chart above. The day’s low could have been used by large players to draw retail traders into short positions and form long positions before the publication of new fundamental information.
How to Identify the Pattern
To identify the “Megaphone” pattern, the chart itself is sufficient. However, the following tools can help ease its detection:
- ZigZag or Fractals indicators – help better visualize extremes.
- Volatility indicators – for example, Bollinger Bands Bandwidth.
- Other tools.
There is a particular technique available to those using the ATAS platform. The essence of the technique is to simply open a Range XV chart. The algorithm for constructing the chart is kept secret, but as seen, this type of ATAS range chart makes it easy to identify expanding triangles (to which the discussed pattern belongs) if you add the ATR indicator with a period = 1.
Example
The gold futures chart is shown below. Data from the Comex exchange.
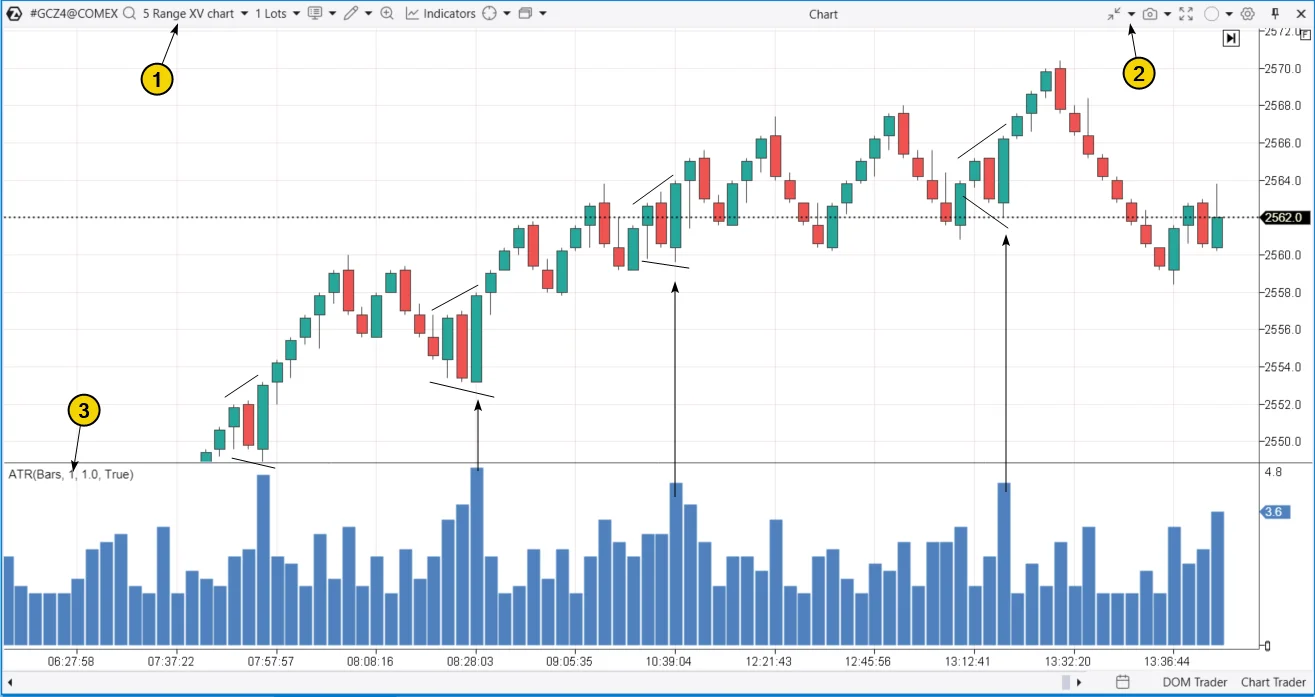
Instructions for Opening the Chart
- Switch the chart to Range XV mode.
- Adjust the Scale if necessary (in this case: Scale = 2).
- Add ATR (Period = 1), change the display from Line to Histogram.
Using ATR Spikes
- ATR spikes can be used to simplify the detection of the “Megaphone” pattern.
- Range XV is the best chart for identifying such patterns.
- In the above example, the four largest bars on the ATR indicate 4 “Megaphone” patterns formed during the day in the gold futures market.
Tip
- You can draw a level in the area of the indicator at its peak values and add an Alert to the level.
- This will allow you to receive signals from ATAS when a “Megaphone” pattern with a specified amplitude forms on the chart.
Analysis of the Example
- The period displayed on the chart above (the first half of August 20, 2024) was bullish.
- The price rewrote the historical record with each maximum, and in each of the 4 cases, the exit from the “Megaphone” pattern was bullish.
- Lower lows lured short positions into unprofitable positions for those who prematurely believed that the ascent to the peak had ended.
Trading Strategies for the “Megaphone” Pattern
The “Megaphone” pattern can be characterized by both uncertainty and a pronounced struggle between buyers and sellers. It is recommended to analyze the context (bullish or bearish) and the specific pattern to act situationally while adhering to risk control.
Trading Strategy Options
- Reversal into the Pattern: It is assumed that the indecision in the market will persist and neither side will be able to take control.
- Context analysis and additional indicators will help to find justifications.
Example
The “Megaphone” pattern on the E-mini futures chart for the S&P 500 index.
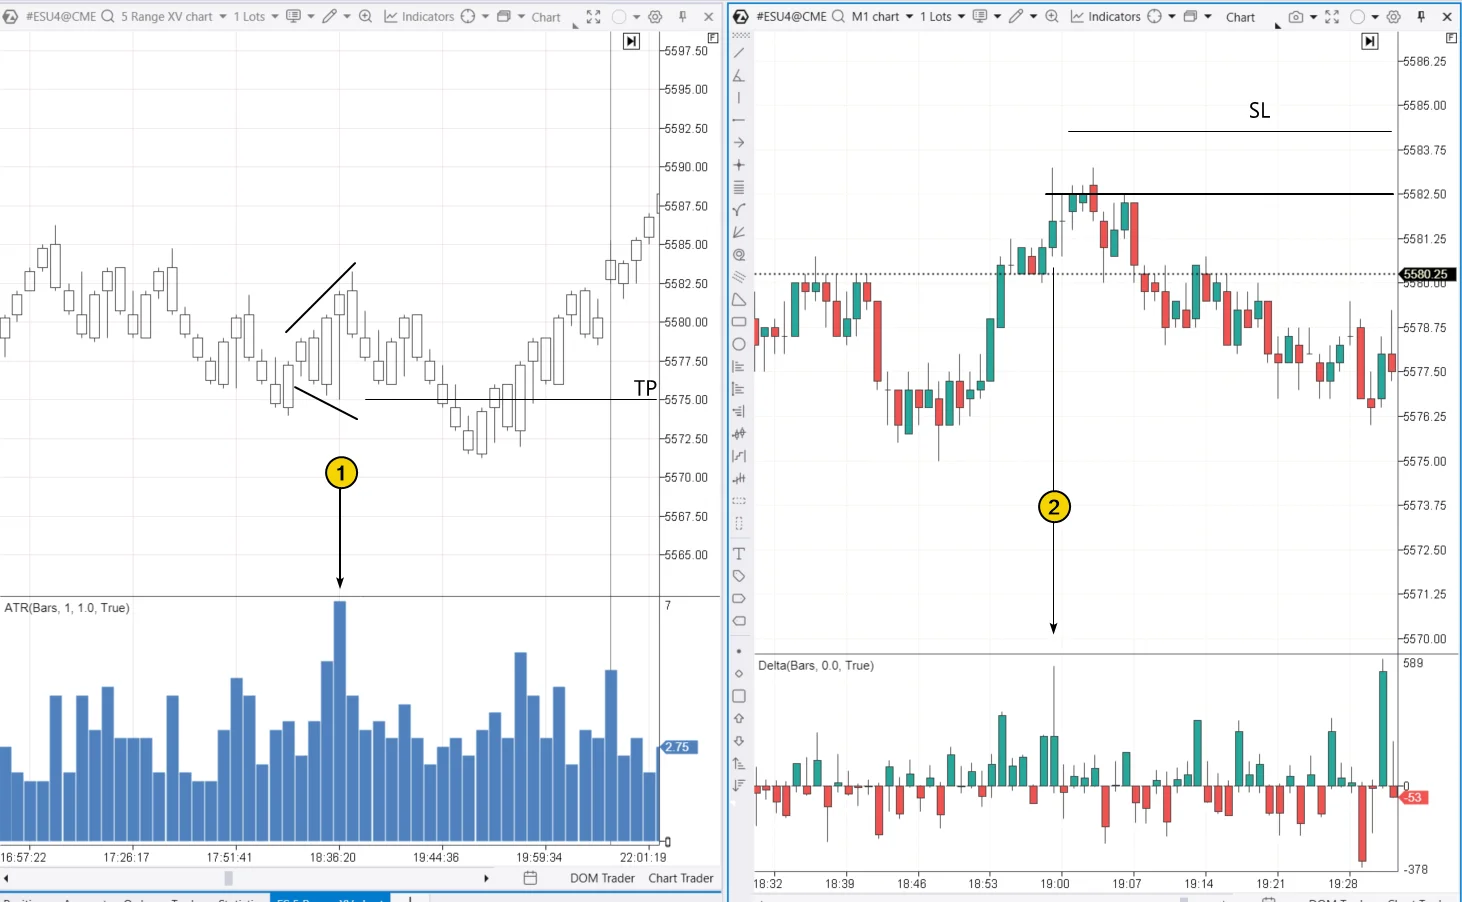
Example of the “Megaphone” Pattern on the Chart
- Number 1 shows the “Megaphone,” clearly visible on the Range XV chart with the added ATR (1) indicator.
- ATR spike: Suppose the trader saw an ATR spike. What next?
- Justification for a sale (trade on a reversal into the pattern) can be provided by a minute chart with the Delta indicator.
- As shown by Number 2, when forming a new peak on the boundary of the expanding triangle, there is an abnormal spike in positive delta, which was “quenched” by sellers.
- This may indicate the activation of stop-losses of sellers – a bearish sign.
- Based on this assumption, it makes sense to place the stop-loss slightly above the new peak and the take-profit at the lower boundary of the “Megaphone.”
- In the example shown, the take-profit worked, albeit not immediately.
Breakout Trading Strategy for the “Megaphone” Pattern
In this case, the calculation is that the period of uncertainty is over, one side has taken the initiative and is showing aggression, while the other side is retreating.
Example
The “Megaphone” pattern example on a cryptocurrency chart, data for BTC/USD from BinanceFutures.
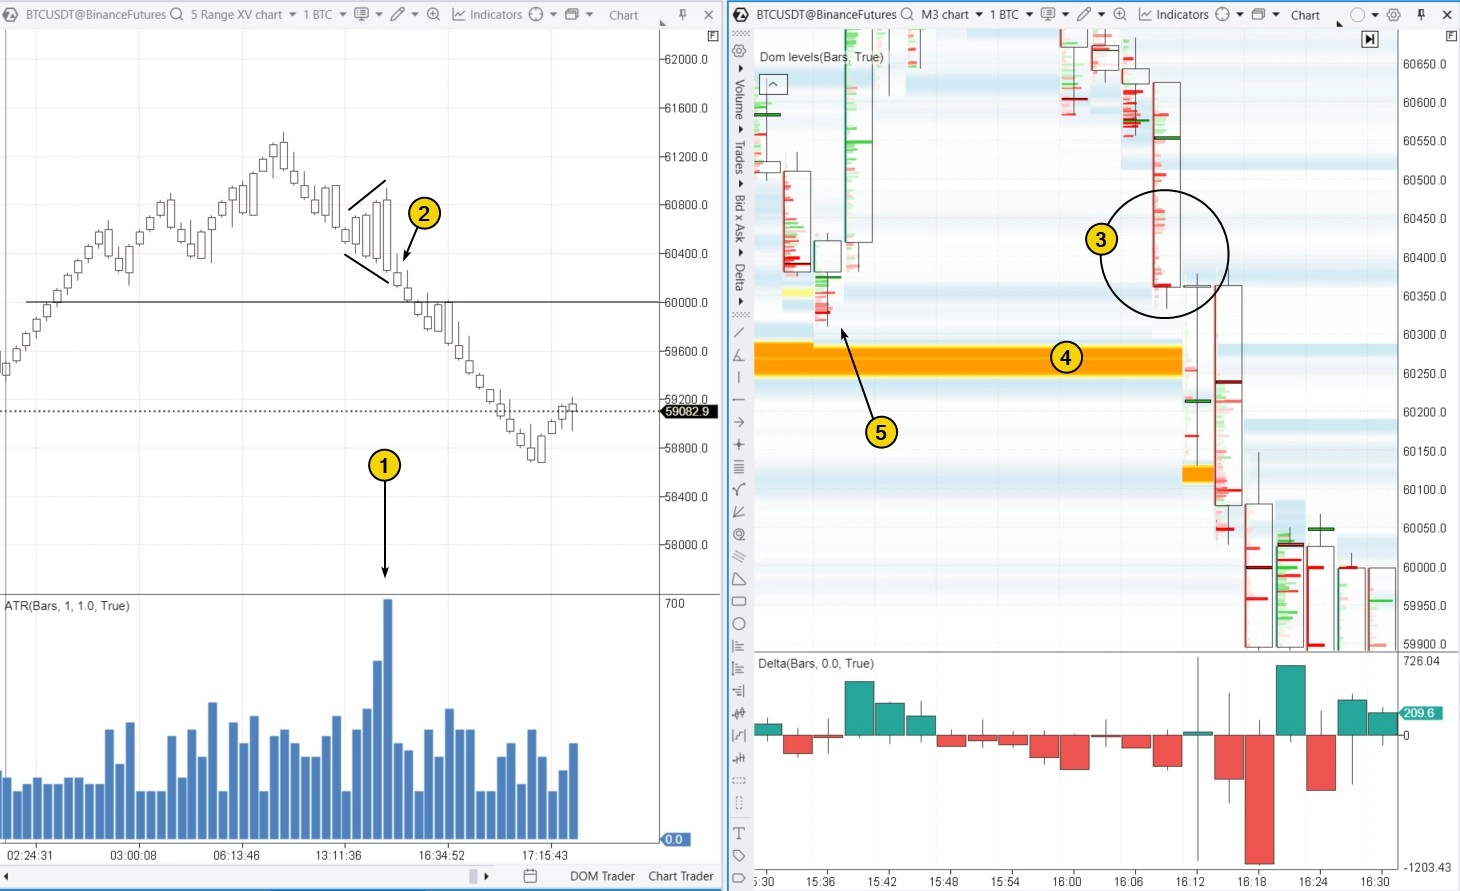
ATR Spike and “Megaphone” Pattern
- Spike (1) on the ATR indicator on the RangeXV chart indicates the “Megaphone” pattern (2).
- How to act: sell on a breakout or buy with the expectation of a return to the pattern?
- Context analysis:
- The “Megaphone” pattern formed after the price of Bitcoin exceeded the psychological level of $60k.
- Perhaps market participants were excited by the idea that the next milestone would be $70k.
- But breaking through the psychological barrier does not mean staying there.
- Analysis of indicators on lower timeframes:
- On the right, a footprint with added DOM Levels and Delta indicators is shown.
- The footprint shows seller aggression and buyer weakness (3) as they approach a large buy-limit order level (4).
- The large buy-limit may have been removed, which “opened the door” for sellers to push prices lower.
- It is possible that the price rise above $60k with a large buy-limit order was a campaign by “Smart Money” aimed at drawing retail traders into emotional purchases and forming a short position at their expense.
Example Trade
- Suppose a short entry is made in the 60200-60300 range on candles from 16:12-16:18, then it makes sense to place the stop-loss above 60500 and target a take-profit below the breakout at a distance at least equal to the height of the “Megaphone” pattern.
- Number (5) marks the sign of an upward reversal from the lower boundary of the “Megaphone” – the footprint shows “trapped” sellers at the minimum of the candle with a close above bright red clusters.
- The price was not yet “ready” to break through the large buy-limit.
False Breakout Strategy for the “Megaphone” Pattern
- The next example is from the Apple (AAPL) stock market.
- The chart below shows two “Megaphone” patterns in a generally bullish market, as indicated by the moving average.
- Number (1) shows the volume profile within the candle, which has the shape of a normal distribution, indicating some balance between supply and demand.
- In the next candle after (1), traders “trapped” at the top were noticed.
- After this, the first “Megaphone” pattern formed, where Number (2) marks traders “trapped” at the lower boundary of the pattern – an argument in favor of an upward exit from the “Megaphone.”
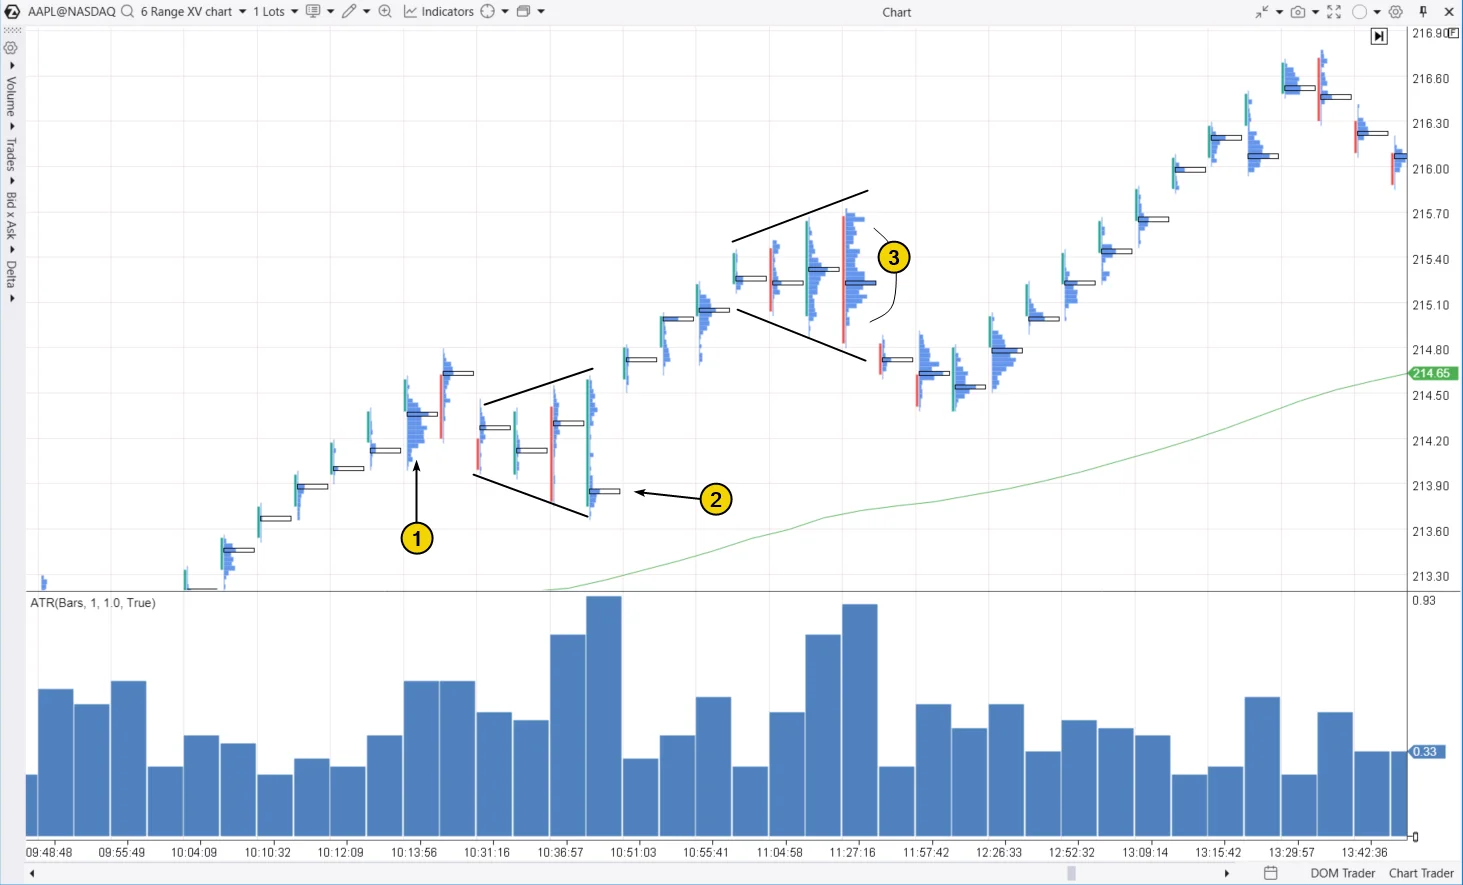
Second “Megaphone” Pattern
- The second “Megaphone” pattern is notable because a profile similar to a normal distribution is also formed here – a sign of agreement between buyers and sellers.
- If there is a deviation from the consensus, it may be insignificant.
- Then, a bearish breakout of the second “Megaphone” occurs.
Possible Scenario
- Suppose the trader assumes that if there is an uptrend in the market and the actual exit from the first “Megaphone” was upward, then the bearish breakout of the second pattern may be false.
- Overall, the assumption was correct. The price tested a significant volume level seen on candle (1) and then continued the intraday rally.
- An excellent entry for a long position, based on such reasoning, could be a purchase at the low of the 12:26:33 candle, where the price tests the large volume of the previous candle.
FAQ
- What is a “Megaphone” in trading?
- A “Megaphone” in trading is a pattern visible on a chart by expanding price fluctuations. It is believed that the pattern indicates increasing volatility and potential market uncertainty.
- Is the “Megaphone” pattern bullish or bearish?
- The “Megaphone” pattern can be either bullish or bearish, as it does not inherently suggest a specific market direction. It is important to analyze the context and use additional tools such as footprint analysis to gain more specific arguments about future price movements.
- Is the Megaphone a trend or reversal pattern?
- The “Megaphone” pattern can serve as both a trend and reversal signal. On the one hand, the temporary uncertainty indicated by the pattern may turn out to be a temporary correction within the current trend, making the “Megaphone” a trend pattern. On the other hand, the “Megaphone” is often seen at market reversals.
- As seen on the previously discussed gold futures chart. ATR indicates increased volatility, and the candle shapes on RangeXV outline the “Megaphone.”
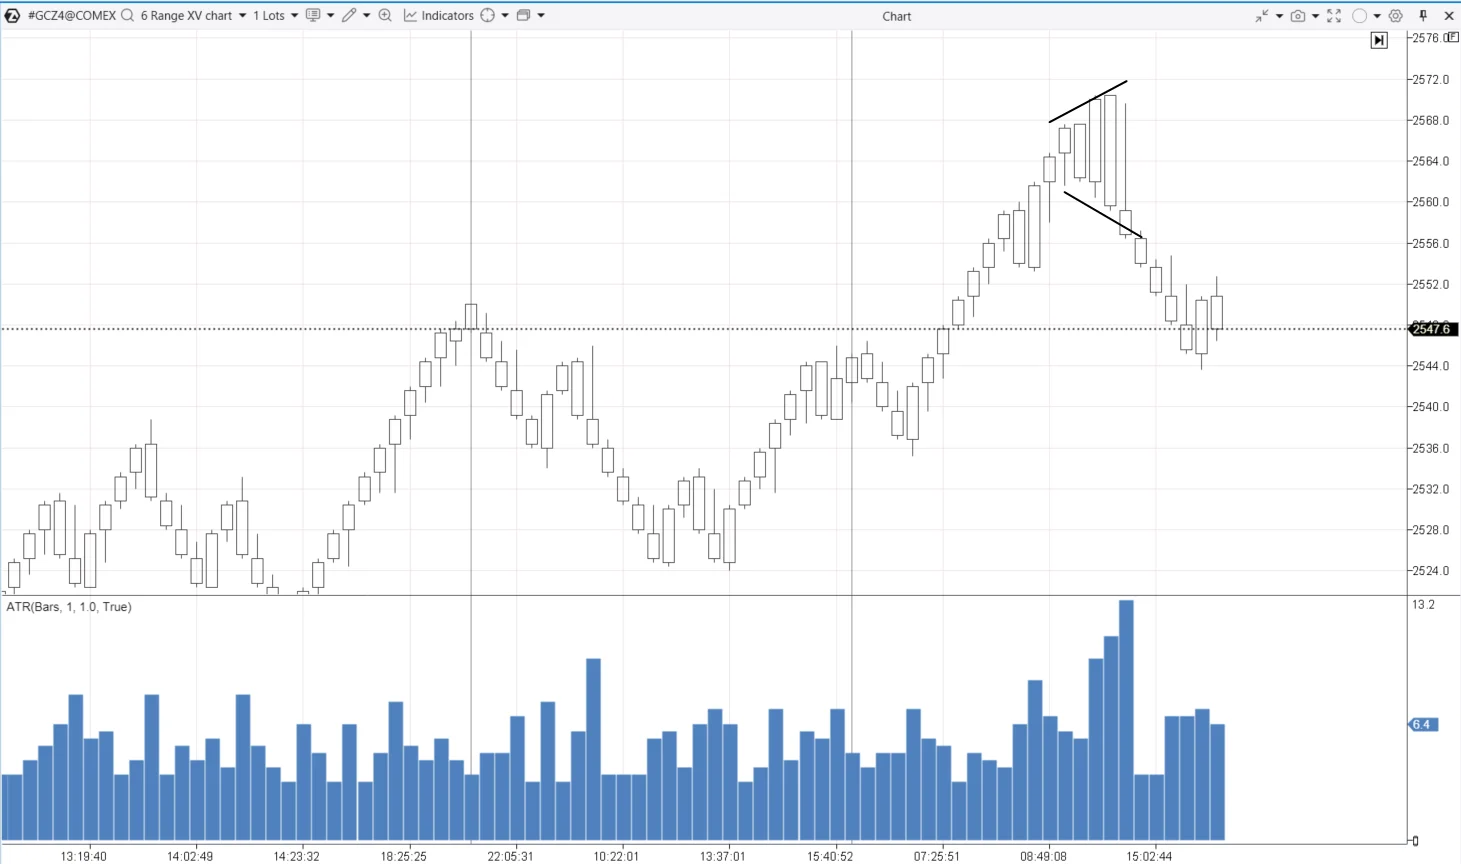
Significance of the “Megaphone” Pattern
- In this case, the pattern indicates increased fluctuations as a sign of a broad active market where Smart Money needs to gather enough liquidity to fully or partially take profits on positions.
How to Trade the “Megaphone” Pattern
- The mere presence of this pattern does not provide clear guidance on the direction of the next move, so it is crucial to apply a comprehensive approach to analysis.
- Trading the “Megaphone” pattern can be done either by breaking its boundaries or by reversing, depending on the context and volume indicators, as well as other factors needed to make informed trading decisions.
How to Learn to Trade the “Megaphone” Pattern
- The pattern is ambiguous as it does not give clear indications of future price direction and can be interpreted differently depending on the context and additional analytical data.
- To answer the question of whether it is possible to profit from trading the “Megaphone” pattern, it is recommended to model it on the ATAS Market Replay simulator for traders.
Using ATAS Market Replay for Learning
- ATAS Market Replay uses historical data to recreate trading conditions in real-time. It is quick, informative, and financially safe.
- To launch the simulator:
- Download, install, and launch the ATAS platform.
- Open the financial instrument chart.
- Click the Market Replay button in the main ATAS menu.
- Activate Replay mode (the icon should turn green).
- If necessary, adjust settings: date, data type.
- Start playback and monitor when an expanding triangle in the form of a Megaphone or another chart pattern appears on the chart to make a trading decision to buy or sell.
Example
- The example below demonstrates how ATR indicates the emergence of the “Megaphone” pattern.
- In this case, among the possible strategies, trading on a false breakout would likely have yielded the best result, as after the bearish breakout of the “Megaphone,” the price reversed from the significant volume level visible on the profile.
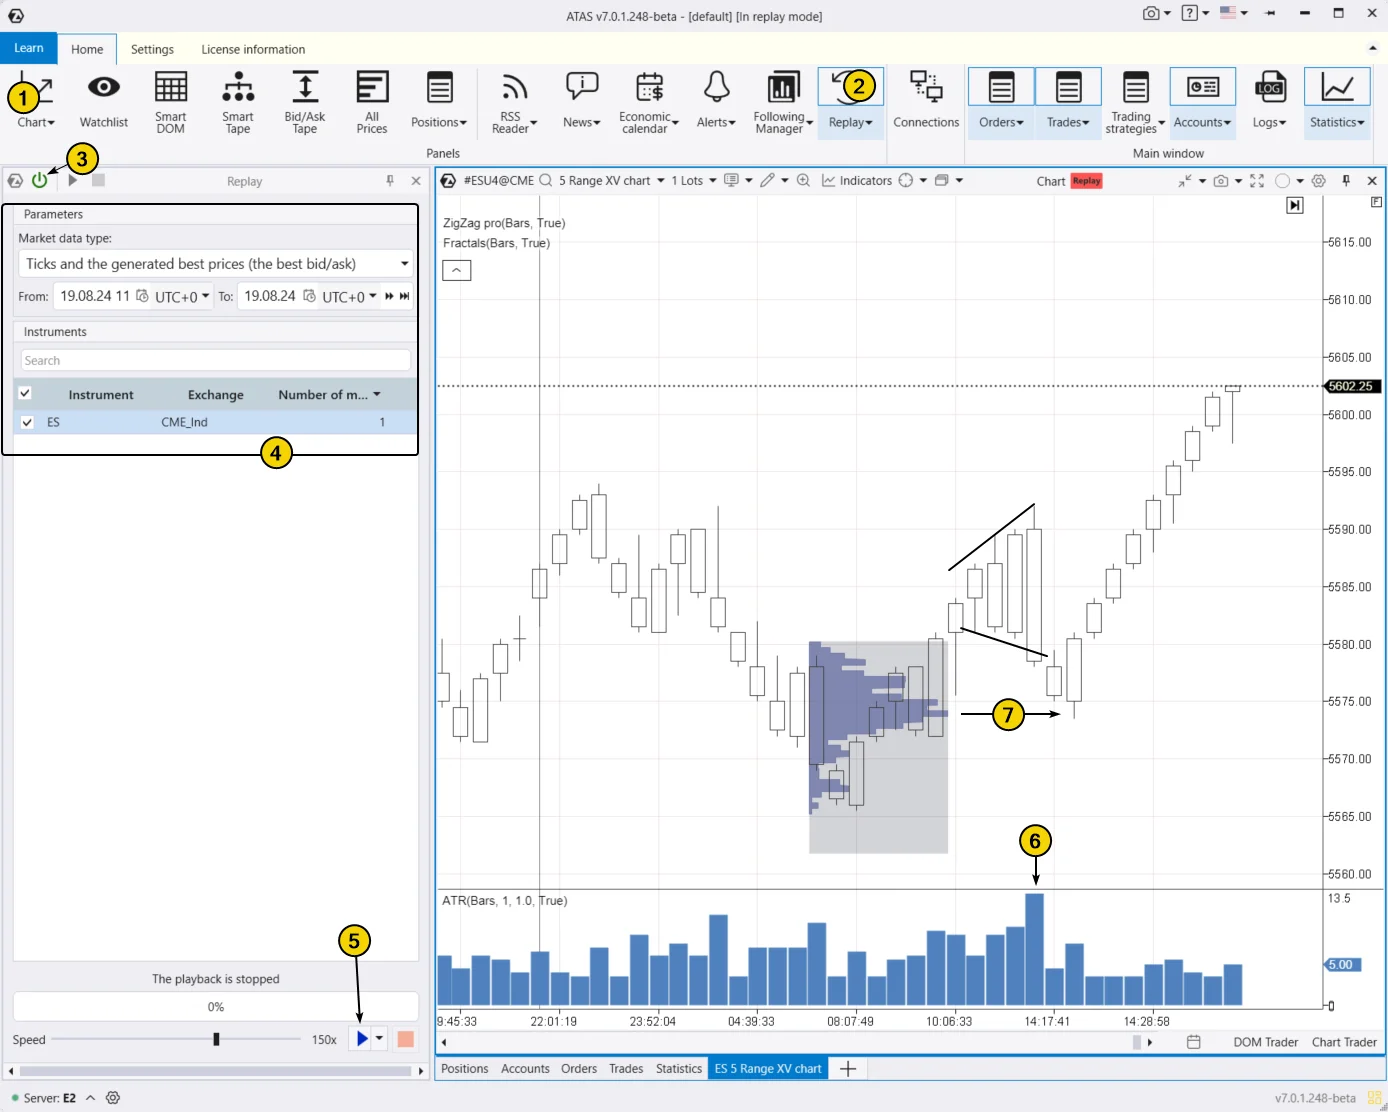
Market Replay Simulator Capabilities in Learning Pattern Trading Strategies
In the learning process, you can:
- Change playback speed, pause.
- Analyze footprints.
- Apply more than 400 indicators.
- Use Chart Trader and other features to trade on the built-in Replay demo account and then analyze your performance.
- Use graphical tools, for example, to mark support and resistance levels.
- Apply different types of charts, such as the Range XV chart relevant to our discussion.
- Implement protective strategies.
- Perform other actions to learn how to catch “Megaphones” and other patterns.
Additional ATAS Capabilities
- ATAS allows you to upload tick history from cryptocurrency, stock, and futures markets, providing a comprehensive database for analyzing the interaction of price and volume.
- This helps to improve the development of your trading strategy by identifying key patterns.
BT
#MegaphonePattern, #TradingStrategies, #ATASMarketReplay, #PriceFluctuations, #VolatilityAnalysis, #ChartPatterns, #FuturesTrading, #TechnicalAnalysis, #SmartMoney, #ATRIndicator, #RangeXVChart, #MarketUncertainty, #FootprintAnalysis, #VolumeIndicators, #BearishBreakout, #BullishTrend, #TradingSimulation, #ProtectiveStrategies, #CryptoMarketAnalysis, #StockMarketAnalysis
![]()

