The Market Profile indicator is a powerful analytical tool that allows traders to visualize and interpret market dynamics by breaking them down into levels.
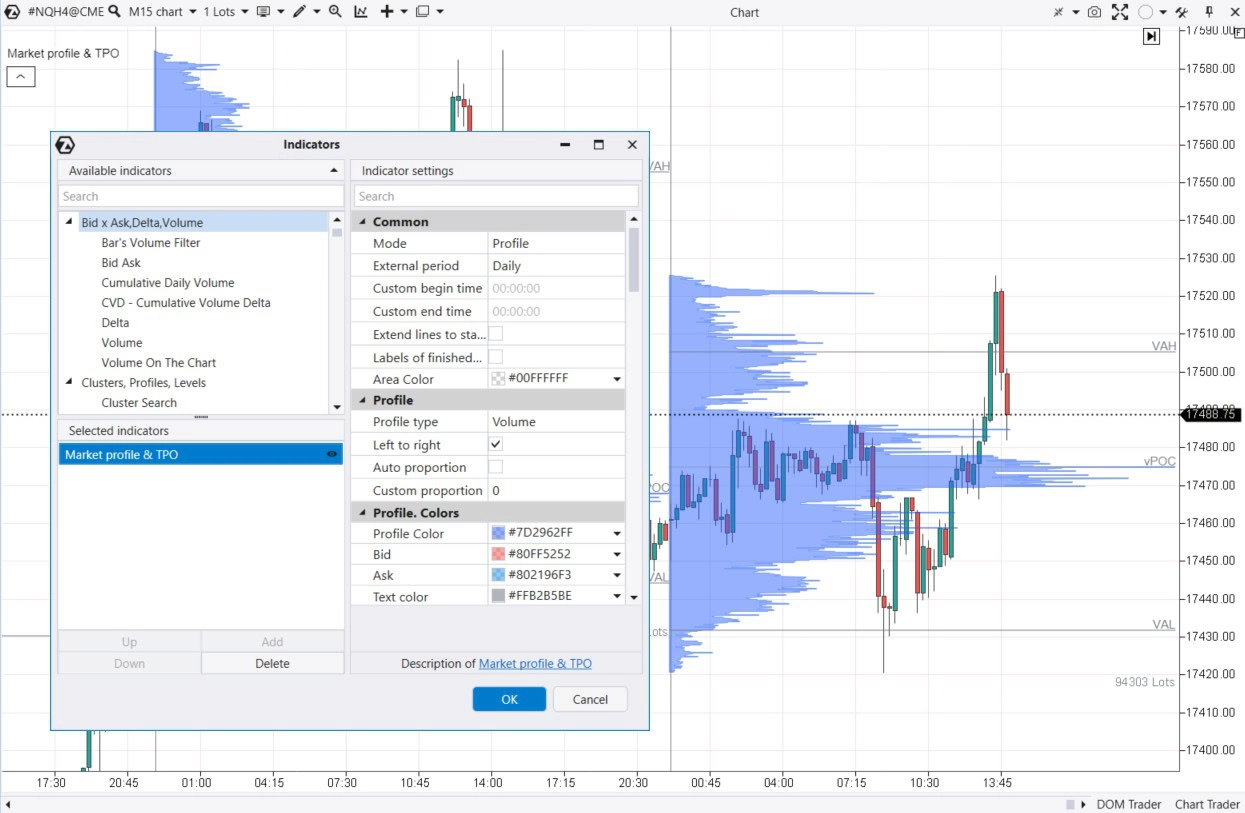
To add the Market Profile indicator to an existing chart in the ATAS platform:
- Press Ctrl+I or the corresponding icon in the top menu of the chart window;
- Select Market Profile from the list of indicators;
- Click Add, then OK.
Example.
The screenshot above shows the daily market profile on a 15-minute chart of the NASDAQ index futures. By default, the indicator is displayed as a blue histogram with horizontal bars for each level.
Key Components of the Market Profile Indicator:
- Price Levels: You can gather information for each level individually or combine multiple levels using the Scale function, allowing you to adjust the profile’s detail.
- Trading Volumes: The indicator identifies key price levels with the highest/lowest trading volumes. The volume can be separated into bids and asks.
- Period: You can set the time interval for which the Market Profile indicator will visualize data.
The Market Profile analysis is based on the idea that prices on the exchange are formed by the struggle between buyers and sellers. The indicator displays the traces of this struggle—volumes at price levels over specific periods of time. This gives traders a clearer understanding of market phases and which price levels are more or less significant:
- Balance Phase: When the profile is convex and bell-shaped (normal Gaussian distribution), it indicates that supply and demand forces are balanced.
- Imbalance Phase: When the profile is thinner, it could indicate that the market is trending. The price is seeking equilibrium—those levels that will equally satisfy buyers and sellers.
THREE TYPES OF MARKET PROFILE REVERSAL SIGNALS
The Market Profile indicator provides traders with various signals to make informed trading decisions. In this article, we will review three main types that can be useful for trading reversals. It is important to remember that any trading signal should be used considering the overall market context in combination with other indicators and analytical methods. This will reduce risks to your capital.
1ST TYPE OF SIGNAL: BOUNCE OFF THE POC LEVEL
This type of signal is based on the interaction of the price with the level where the maximum trading volume was recorded in the past for the selected period. This level is also called POC (Point of Control), and the signal is a test of the POC level. Since trading at the POC level was very active, this level is of great interest to market participants, and likely, many positions were opened at this level. As practice shows, this is one of the reasons why the price often reacts to this level.
Example 1: NQ Futures, 15-Minute Chart
To more clearly show the market context immediately before the signal, we did not plot the profile for sections with a white background in all illustrations of this article. In the screenshot below, we used the arbitrary profile drawing tool. It allows you to instantly build a market profile for any section highlighted by the mouse on the chart. When analyzing the profile during the European trading session, a balance was formed approximately between the levels of 17150-17190. Then, buyers gained the upper hand, and the balance shifted upwards.
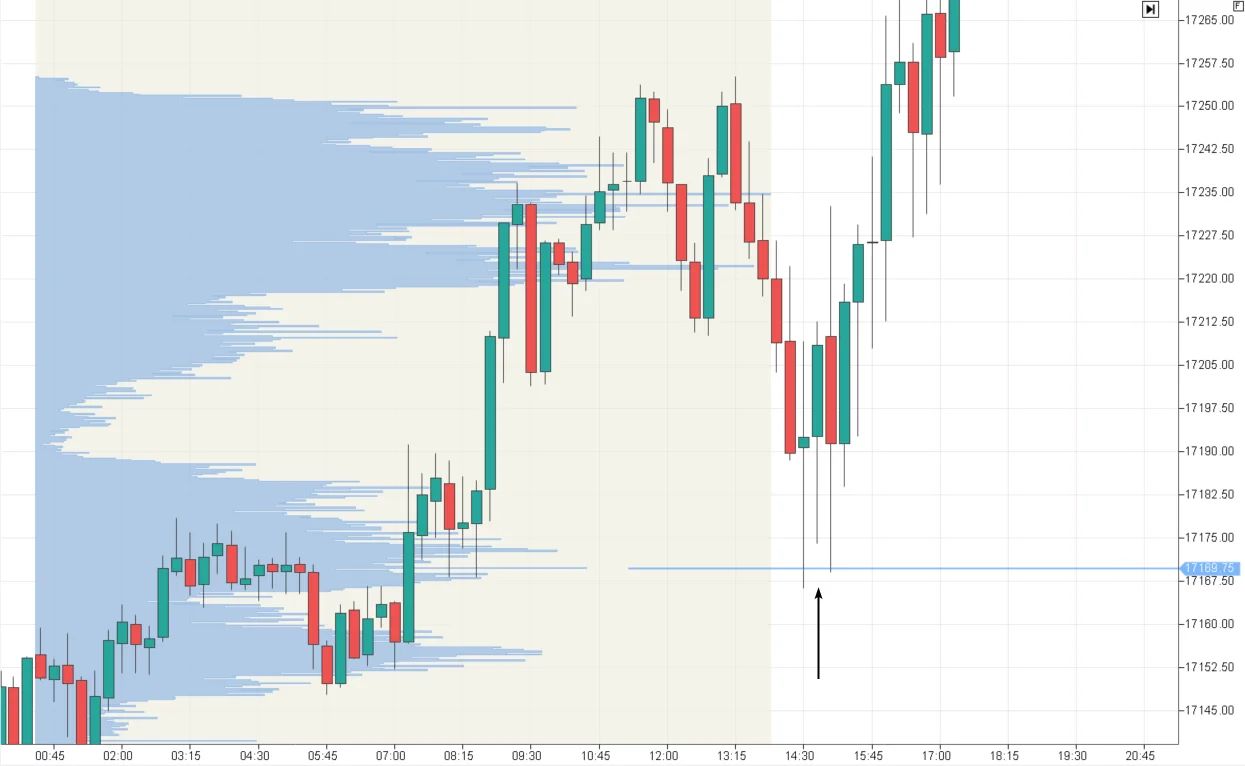
During the more volatile American trading session, there was a test of the high-volume level near 17170—the POC level of the European session balance. Thanks to the market profile, traders could use this test to establish long positions in the direction of the emerging bullish trend.
Example 2: CL Futures Market, 30-Minute Chart
During the American trading session, there was a test of the previous day’s Point of Control level—an opportunity to open a buy position.
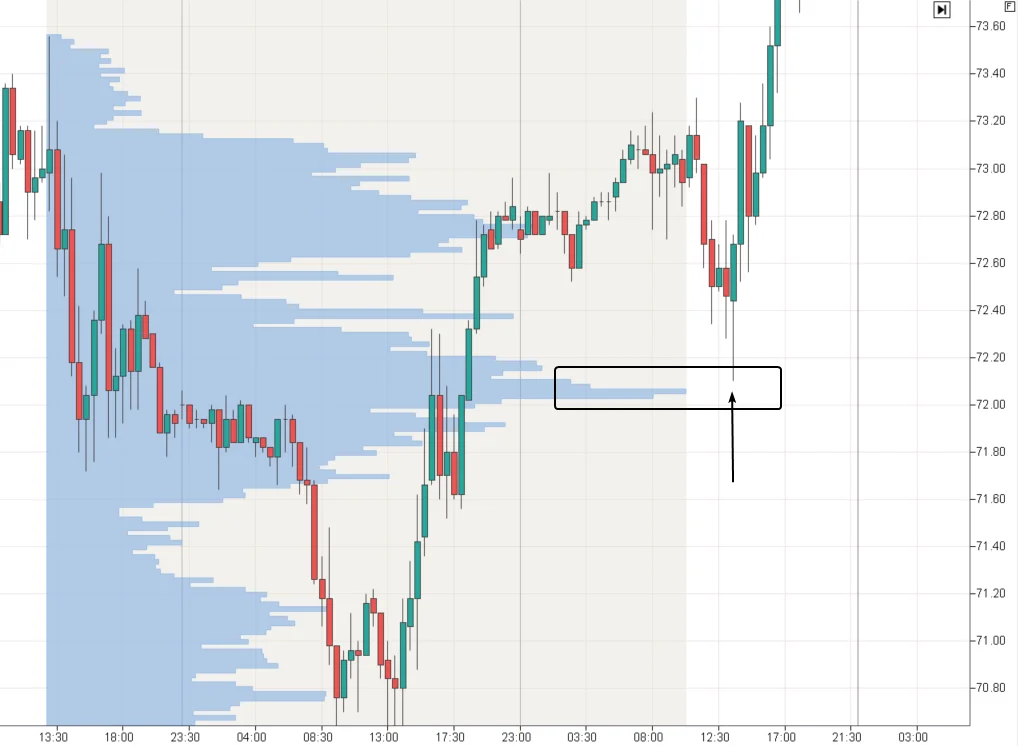
The price almost reached the test with tick accuracy. Ideal tests are rare, although this would greatly simplify the task for traders.
How to trade the “bounce off POC” signal:
- Identify important high-volume levels (Point of Control) of the previous day, several days, or hours—depending on the preferred timeframes.
- Wait for the high-volume level to be tested—if possible, get confirmation signals on lower timeframes.
- Enter a position expecting a bounce.
- Place a stop-loss beyond the high-volume level.
- Set a target that will comfortably compensate for the potential loss.
Pros of the signal:
- Based on the logic that newly formed high-volume levels indicate trader activity. Therefore, when this level is tested, market participants are expected to defend their positions, leading to a price reversal.
- The signal allows improving the risk-to-reward ratio.
Cons of the signal:
- The profile does not always form clear Point of Control levels.
- The price does not always test levels. And if it does, it’s not always tick for tick.
- On momentum, the price may break through the POC level without forming a significant bounce.
2ND TYPE OF SIGNAL: BOUNCE OFF THE “STEP”
A “step” is an informal term for a place on the market profile where wide bars sharply transition to narrow ones. This is where the boundary between zones of active and inactive trading lies. As practice shows, when the price reaches this boundary, a reversal occurs—a bounce off the “step.”
Example 1: NQ Futures, 15-Minute Chart
The chart shows the formation of two balances: balance A with the upper boundary (step) marked at 17441.50; the subsequent balance B with the lower boundary (step) marked at 17551.50.
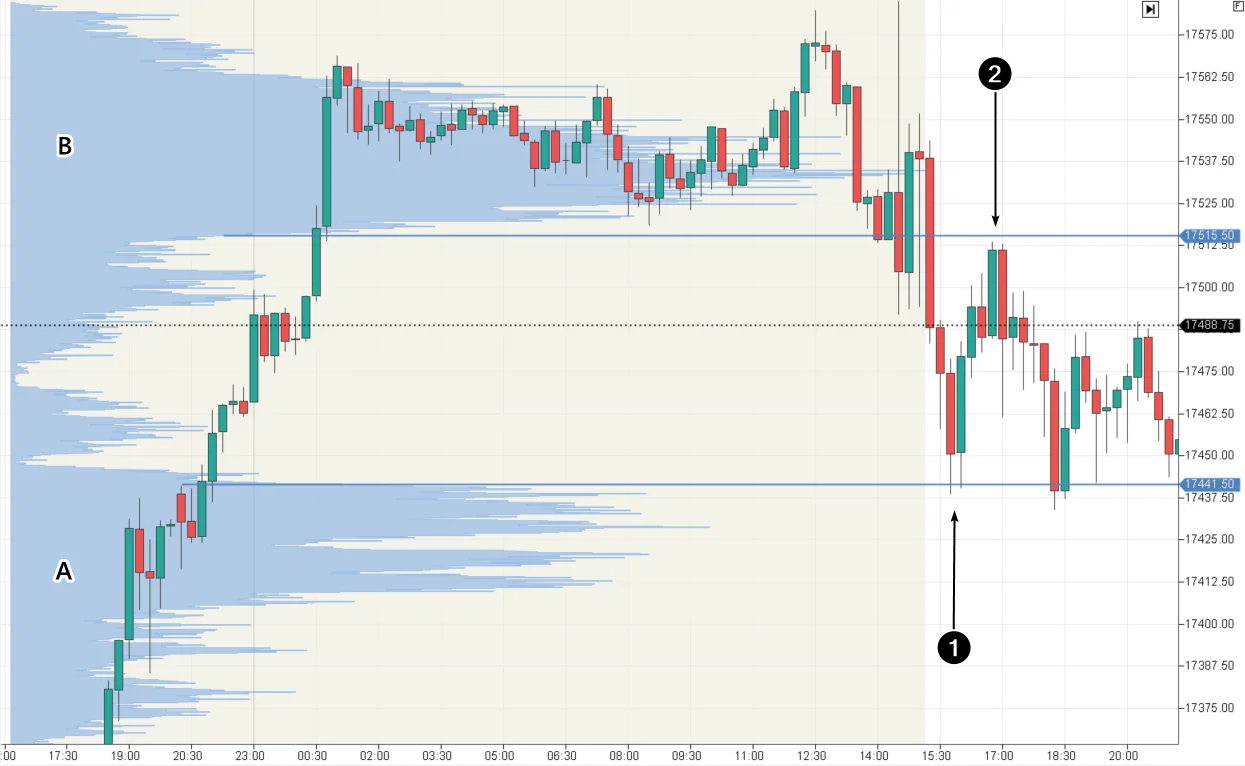
After the price moved down from balance B (broke it bearishly against the backdrop of fundamental news), it made a reversal (1) from the step at 17441.50. When the price moved up, it encountered resistance (2) at the 17551.50 step. After that, it moved down and again bounced off the step at 17441.50.
In this situation, intraday traders could:
- Use the described levels to plan trades;
- Switch to lower timeframes to find confirming signals (e.g., on a cluster chart);
- Enter a position on the “bounce off the step” with an acceptable risk-to-reward ratio.
Example 2: FDAX Futures, 15-Minute Chart
This chart provides a clue on how to use steps to build a trend-following trading strategy.
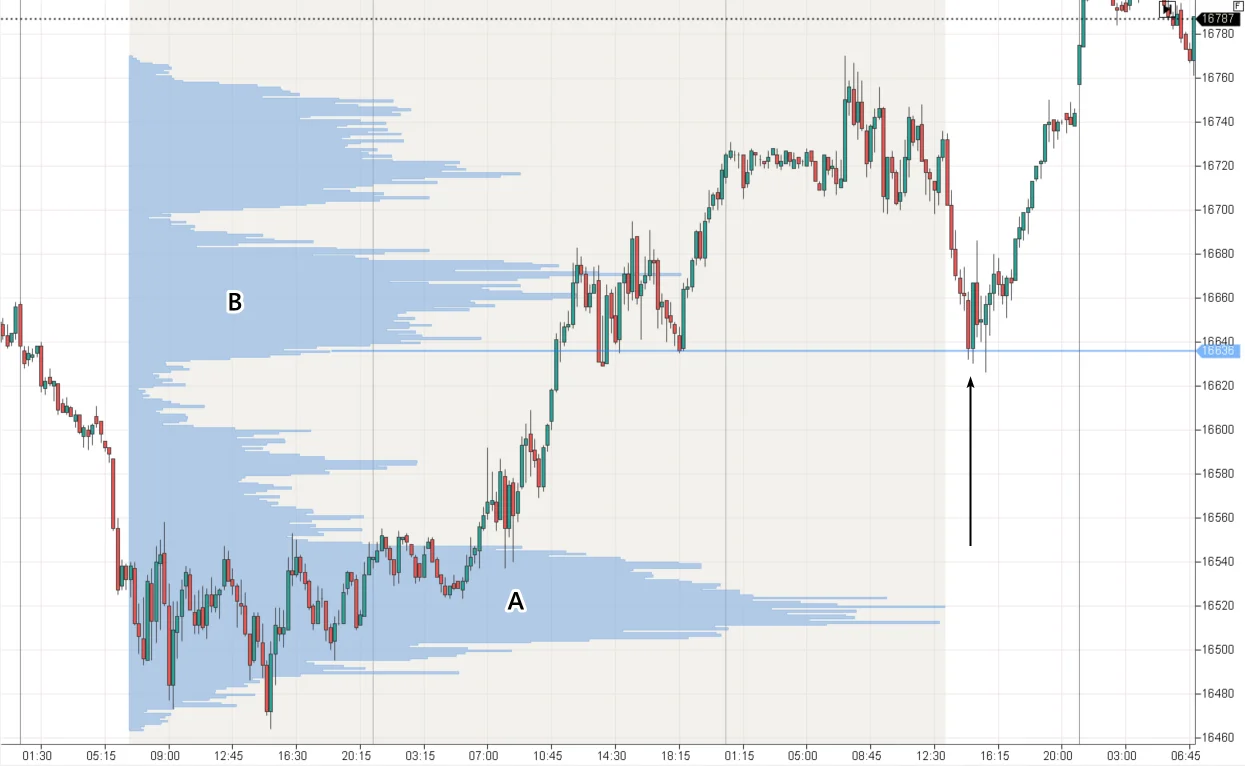
The price broke balance A and moved upwards—a bullish sign that may indicate the beginning (or continuation) of a significant uptrend.
The formation of a new balance B at a higher level confirms that the market is in a bullish mood. Buyers dominate. The lower step of the new balance B at 16636 is the boundary of opinions where supply and demand forces balance each other. Below, we see that sellers are not willing to part with their contracts cheaply. Testing such a step may provide a good opportunity to enter a trade, assuming the uptrend will continue and form a higher (or lower) balance C, D, and so on.
How to trade the “bounce off the step” signal:
- Identify important contrasting “steps.”
- Wait for the “step” level to be tested—if possible, get confirmation on lower timeframes.
- Enter a position expecting a further bounce.
- Place a stop-loss beyond the step level.
- Maintain an acceptable risk-to-reward ratio.
Pros of the signal:
- Based on the logic that “steps” are boundaries of market participants’ opinions and can indicate sharp changes in sentiment. When this level is tested, a price reversal is expected. Trades can be planned for a return to the balance zone (second example) or the imbalance zone with a narrow profile (both bounces in the first example).
Cons of the signal:
- Identifying “steps” on a specific chart is highly subjective.
- The price does not always test “steps.” And if it does, it’s not always tick for tick.
- A potential test of the “step” could quickly turn into a failure (its breakout).
3RD TYPE OF SIGNAL: BOUNCE OFF THE IMBALANCE LEVEL
A bounce off the imbalance level is the mirror image of the first signal, “Test of the POC level.” If the Point of Control is the levels of maximum volume, imbalance levels (let’s call them that) are built on minimal volume. They are formed when the price changes very quickly:
- Rapid Rise: There is a shortage of sellers in the market, and traders buy “whatever is available.” The price has no reason to linger.
- Rapid Fall: There is panic in the market. Buyers have left, providing no support for the price.
Example 1: Bitcoin Futures on Binance Exchange, 4-Hour Chart
The price rose rapidly (first arrow) in anticipation of news about the SEC (U.S. regulator) approving a Bitcoin ETF. At the same time, a narrow spot formed on the profile at 40427.5.
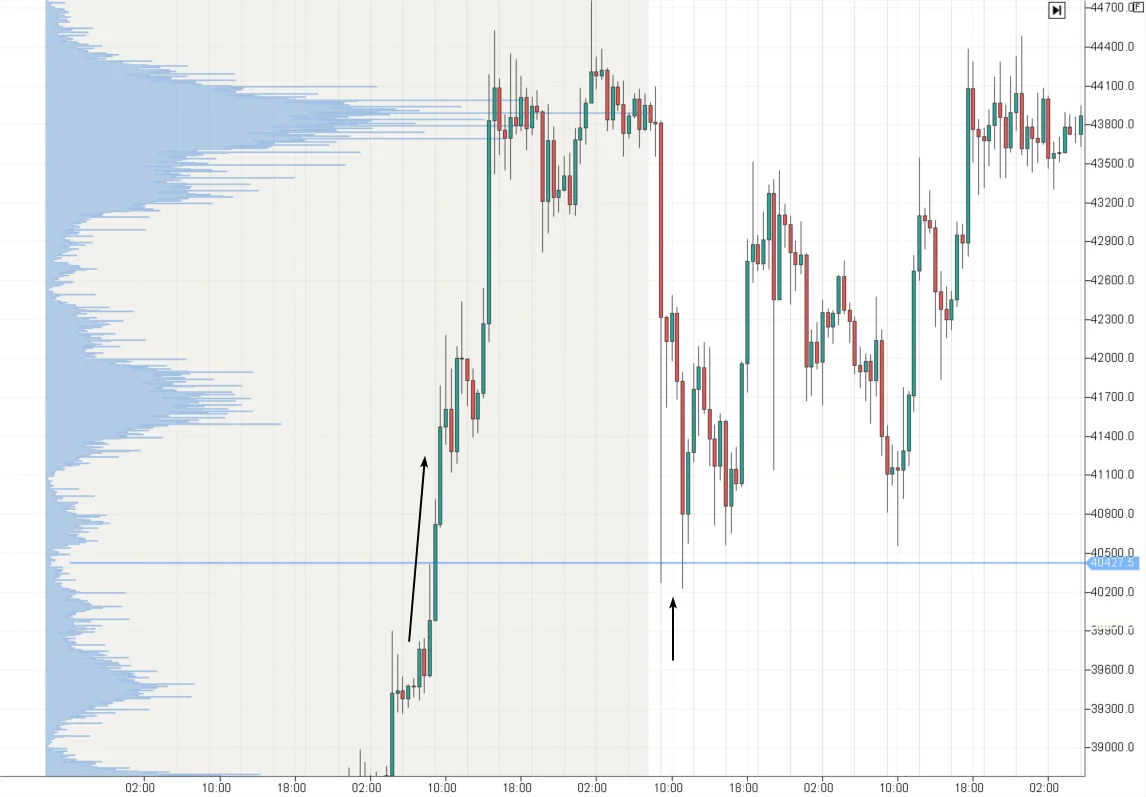
When the news background shifted from extremely optimistic to alarming, there was a sharp drop. The cryptocurrency price twice found support (second arrow) precisely at the imbalance level (narrow profile). Due to the volatility of the Bitcoin market, it was almost impossible to enter a buy trade on a bounce from the marked level in a calm mode. However, the example demonstrates the effectiveness of the signal. You can verify this yourself by downloading ATAS and researching price behavior at imbalance levels.
Example 2: Euro Futures, 5-Minute Chart
The chart below shows a bearish market with sequentially forming balances—each new one lower than the last.
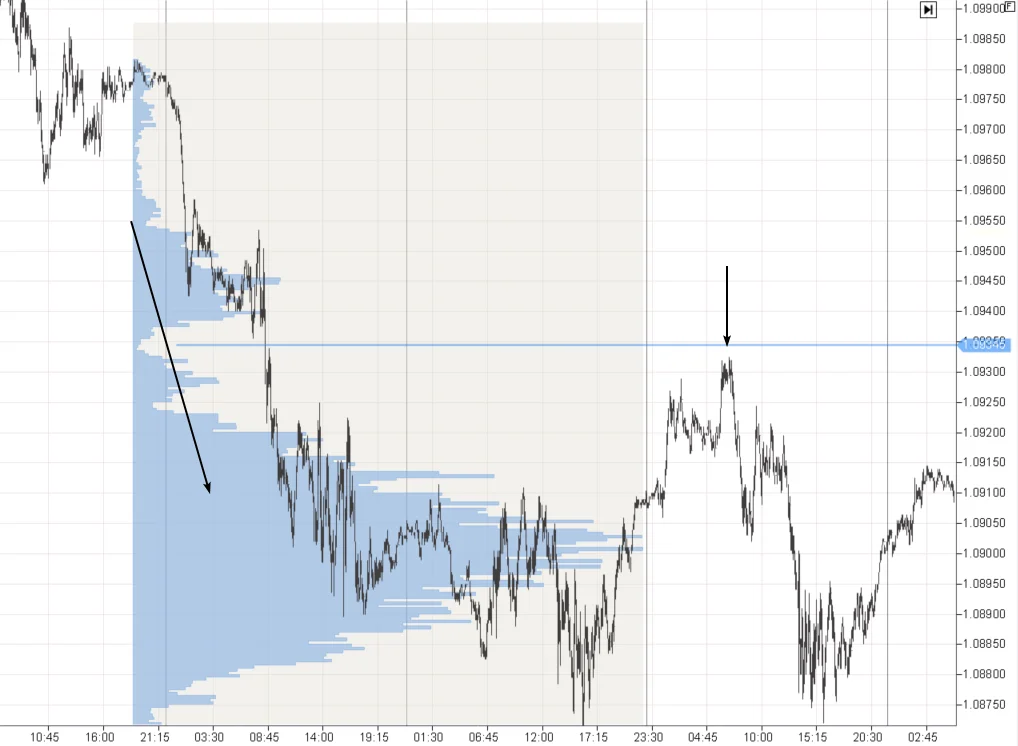
At the 1.09345 level, the price fell particularly sharply. During the early European session, we saw a bearish breakout of the balance that had formed during the Asian session. The next day, this level acted as resistance, providing traders with an opportunity to open short positions.
How to Trade the “Bounce off the Imbalance Level” Signal:
- Identify areas with a thin profile where one side has a clear advantage over the other.
- Wait for the imbalance level to be tested — if possible, get confirmation on lower timeframes.
- Enter a position expecting a bounce.
- Place a stop-loss beyond the imbalance level.
- Maintain an acceptable risk-to-reward ratio.
Advantages of the Signal:
- Based on the logic that the imbalance in market sentiment may persist, potentially leading to a reversal after testing the thin profile level. This signal helps in trend-following trades, which typically result in a narrow profile.
Disadvantages of the Signal:
- Thin areas on the profile can be stretched and unclear. The price does not always test imbalance levels, and if it does, it may not be precise. A potential test of the imbalance level may result in the price moving sharply in the opposite direction, without any sign of a bounce forming.
Market Analysis Using the Market Profile Indicator: Benefits and Limitations
Benefits:
- Deep Market Understanding: The market profile provides a detailed view of the actual activity of buyers and sellers, consolidating information on current trades in a convenient format. This approach is advantageous compared to trading based on moving averages, where crossovers can occur at any moment by simply changing the period.
- Identification of Support and Resistance Levels: The indicator helps identify strong support and resistance levels, which can be critical for reducing risks and making decisions on entering or exiting trades.
- Versatility: The market profile can be an effective tool for trend-following or bounce trading in futures, stocks, or cryptocurrency markets.
Limitations:
- Complexity of Interpretation: For beginners, the indicator may seem complicated, requiring time to study and understand.
- Need for Additional Analysis: The market profile works best in combination with other tools and analysis methods, which may require additional knowledge and skills from the trader.
- Subjectivity: Like many volume analysis tools, the interpretation of the market profile indicator is often subjective, leading to situations where “I am the artist, and I see it this way.”
BT
Market Profile Indicator, Trading Tool, Market Dynamics, ATAS Platform, Price Levels, Trading Volumes, Time Periods, Market Balance, Market Imbalance, Point of Control (POC) Level, POC Signal, Step Signal, Imbalance Signal, Market Reversal, Risk Management, Trading Strategy, Support and Resistance, Trade Analysis, Volume Analysis, Trading Indicators, Futures Trading, Stock Trading, Cryptocurrency Trading, Market Interpretation, Trading Signals, Trading Context, Advanced Trading, Market Visualization, Market Analysis
![]()

