⇒ Warning. Any strategy does not guarantee profit on every trade. Strategy is an algorithm of actions. Any algorithm is a systematic work. Success in trading is to adhere to systematic work.
WHY ANALYZE VOLUMES
Why does the market price of a product (stocks, cryptocurrencies, etc.) change? Because the law of supply and demand is in effect: if there are more buyers, the price rises; if sellers dominate, the price falls.
Example. A graphical illustration of the law of supply and demand. The graph shows two intersecting curves—demand (D) and supply (S)—which determine the equilibrium point (E, equilibrium) and the equilibrium price. This graph is familiar to anyone who has studied the basics of economics in higher grades.
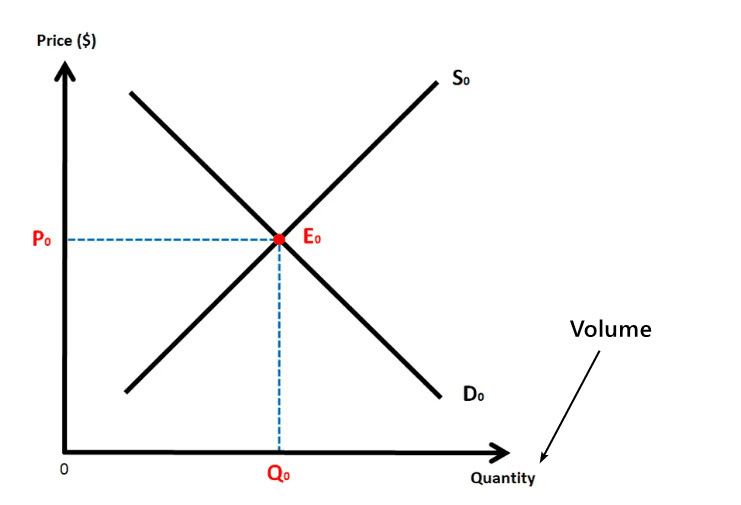
Pay attention to the x-axis – it works with the measurement of Q, quantity. Essentially, this represents volume.
In simple terms:
✔ In theory, the analysis of supply and demand is always linked to trading volumes.
✔ In practice, modern volume indicators allow traders to track how trading activity changes at different price levels over time (as will be shown later).
✔ This approach helps identify changes in the supply/demand balance and build forecasts for the most probable price movement using only the chart.
VERTICAL
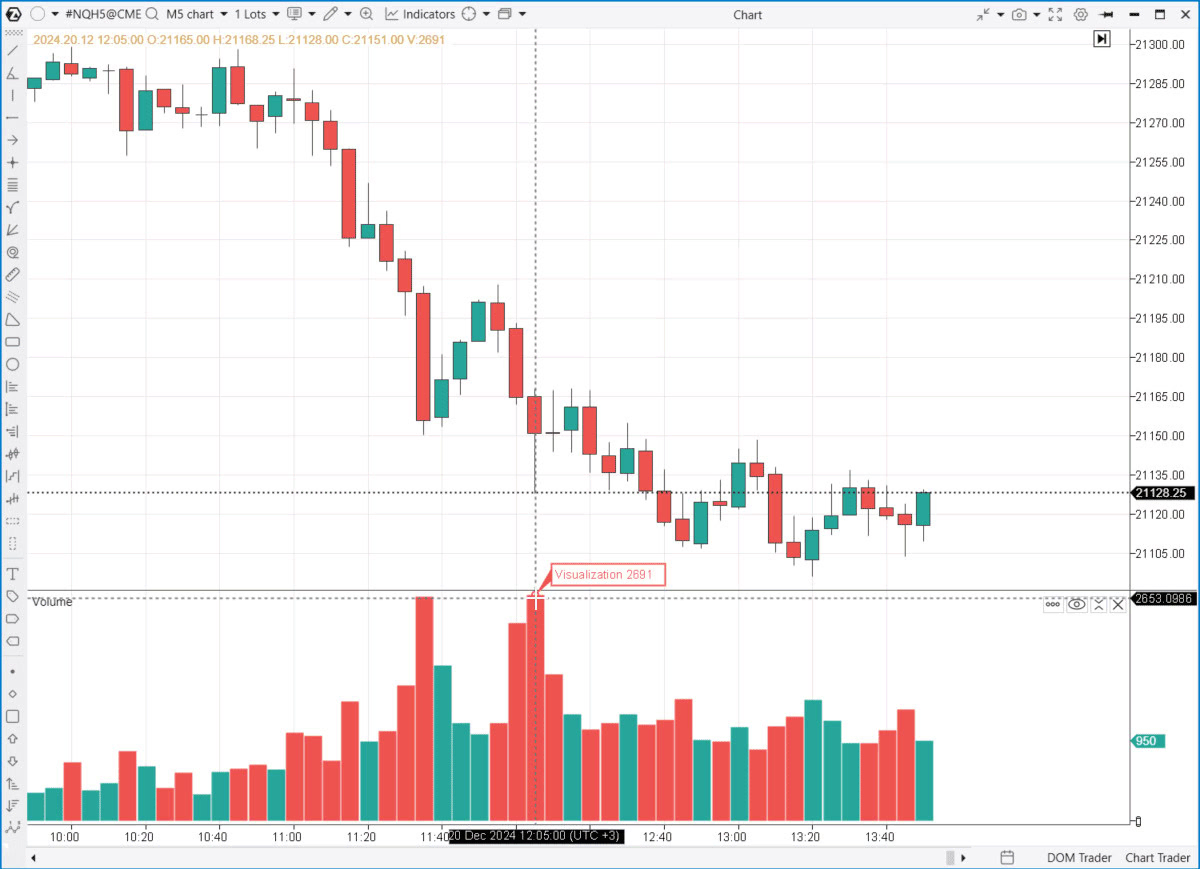
The vertical volume indicator, known as Volume, is displayed as a bar histogram below the price chart. It shows the trading volume for each candlestick (bar) and is a classic tool that is available by default on most trading platforms.
Example. A 5-minute chart of the E-mini futures on the Nasdaq 100 index. The data is provided directly by the CME Group exchange, where this futures contract is traded.
HORIZONTAL (PROFILE)
Horizontal volumes are also displayed as a histogram but show trading activity at each price level over a certain period of time.
Horizontal volumes and market profile (Market Profile) have been actively used in trading since 1985 when Peter Steidlmayer, a trader at the Chicago Mercantile Exchange (CME), introduced the concept of analyzing market structure using volumes. His approach was based on the idea that market price moves around fair value, where the highest trading volumes are observed.
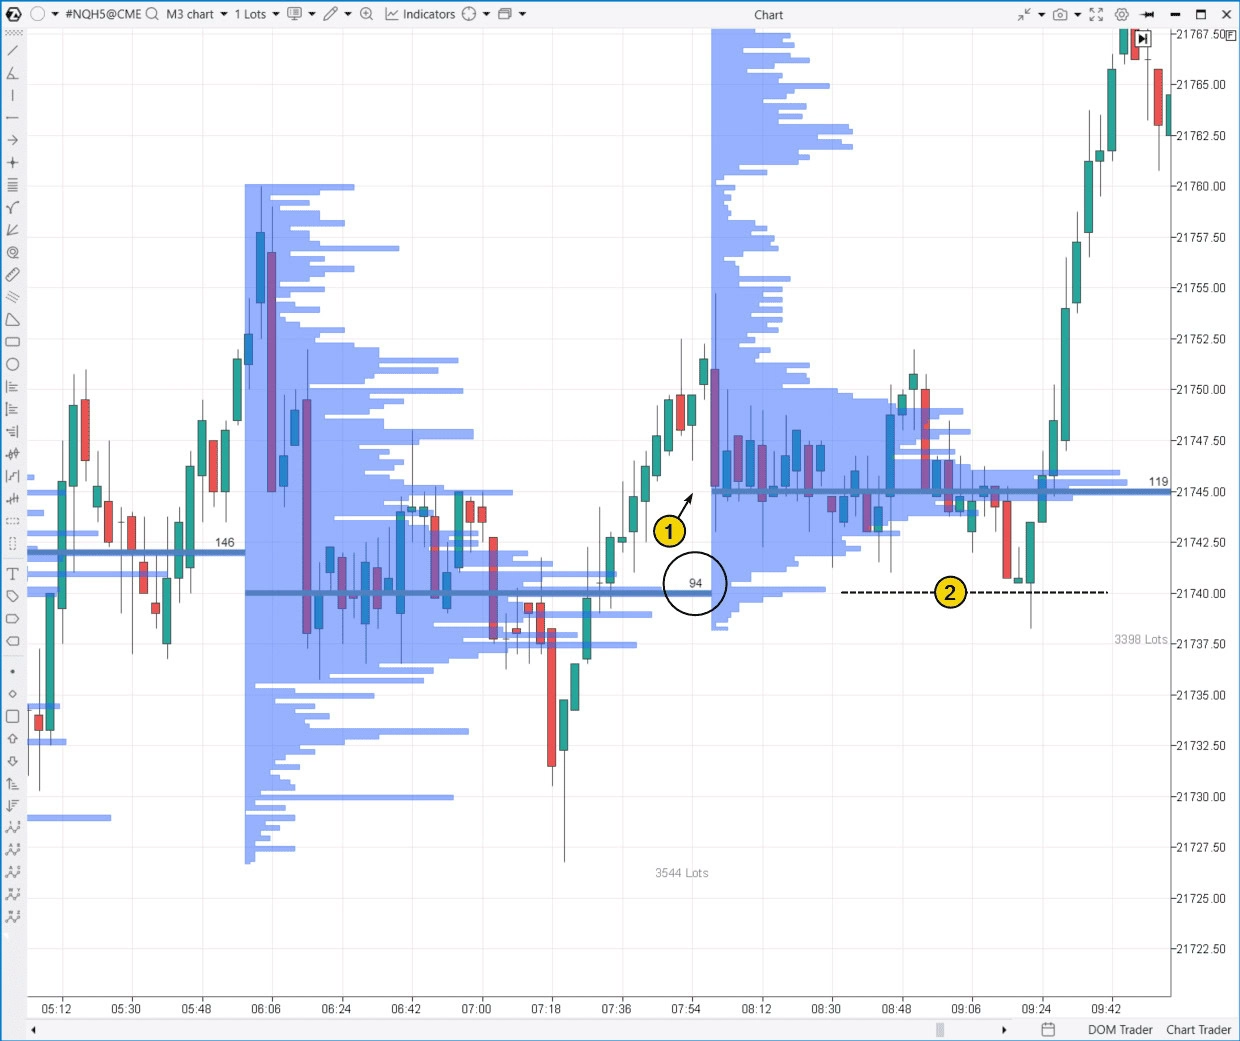
Example. A 3-minute chart of E-mini NQ futures (which represents the movement of the technology stock index) has the TPO and Profile indicator added, with a 2-hour period.
How to Use the Horizontal Volume Indicator?
The horizontal volume indicator provides statistical data on trading activity. For example:
- A circle marks the price level where 34 contracts were bought/sold over 2 hours.
- The bottom right of the indicator shows the total number of contracts traded during this period.
Indicator analytics help assess changes in market sentiment. In this example:
- For some time, supply and demand were in balance (visible in the profile releases) within the 21737-21741 range, after which an upward shift occurred.
- After that, the previous balance zone became support.
ADVANCED VOLUME INDICATORS
In addition to widely used horizontal and vertical volume indicators, traders apply additional tools for deeper market activity analysis:
✔ Delta indicator, including cumulative delta;
✔ Cluster analysis (footprint);
✔ VWAP indicator;
✔ Market depth and heat maps indicator;
✔ Order flow and speed tape indicator.
DELTA
This indicator displays the difference between:
- Asks — trades executed by aggressive buyers.
- Bids — trades executed by aggressive sellers.
📊 Positive delta indicates dominant buying activity.
📉 Negative delta signals the dominance of sellers.
If you are unfamiliar with bids and asks, we recommend checking out our articles on market mechanics:
🔹 Bids — represent the order book for buying.
🔹 Asks — represent the order book for selling.
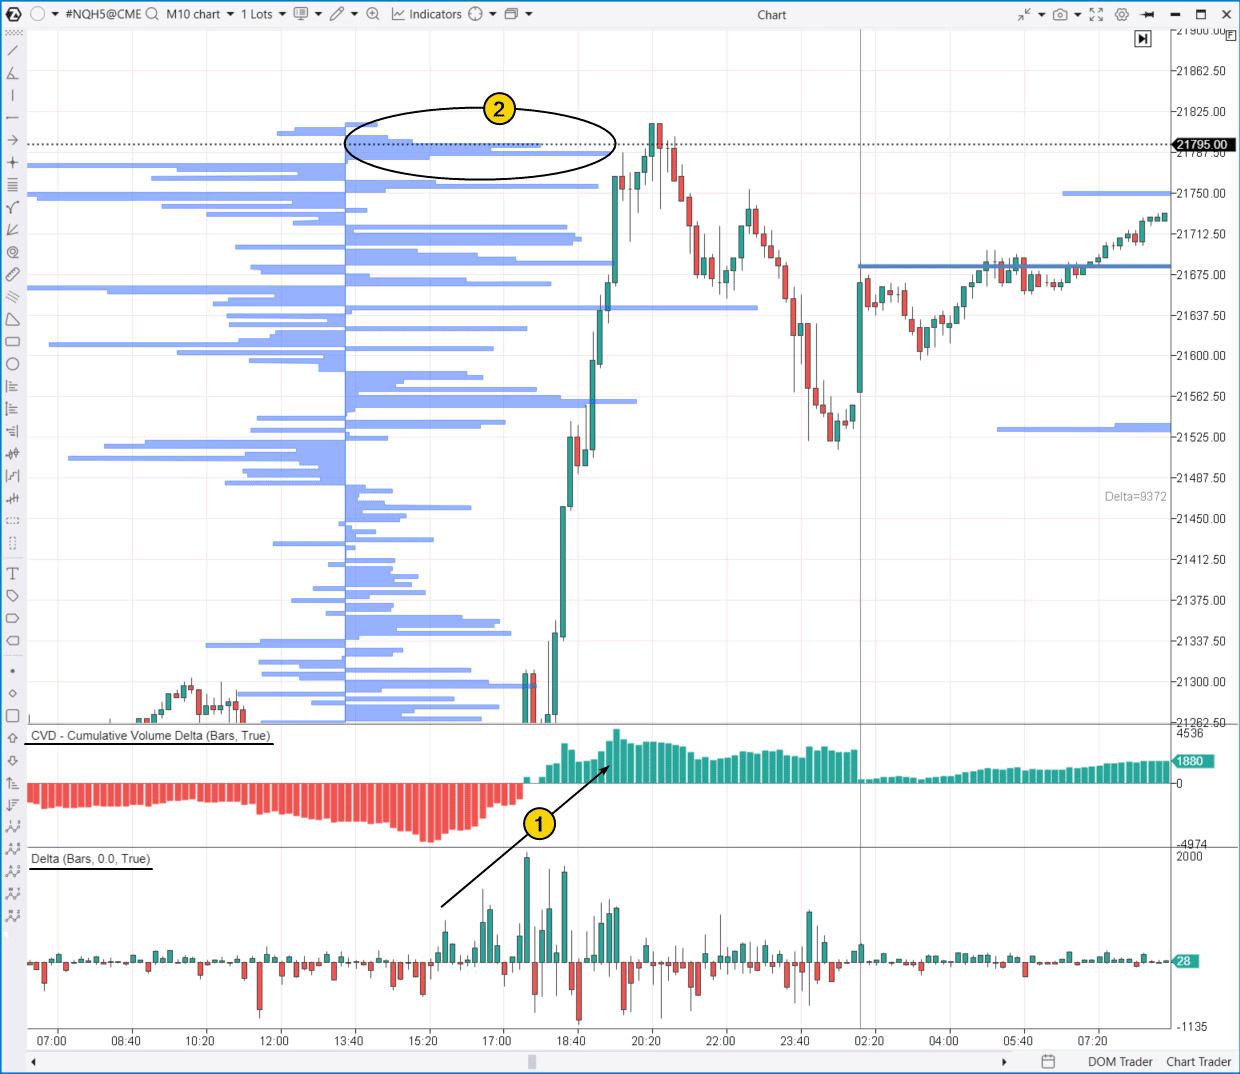
Example. The chart below shows 3 types of delta:
- At the bottom — classic delta for each candle.
- Also at the bottom — cumulative delta, which aggregates values for all candles and resets at the end of the day.
- Displayed on the right (dominant buying activity) and negative on the left (dominant selling activity).
Volume Indicators and Their Role in Market Analysis
Volume indicators help “read” the trading day history:
1️⃣ Traders started taking the initiative, buying contracts at market prices, leading to an intraday uptrend.
2️⃣ Traders who made buying decisions too late found themselves trapped in a bull trap at the market peak.
📝 Tip. Pay attention to the CVD Pro (Multi) indicator – it helps build cumulative delta for traders with different capital sizes, providing a more detailed view of market sentiment.
📌 Learn more about using the Delta indicator for trading decisions:
🔹 What is Delta and Cumulative Delta
🔹 How to Trade Using the Delta Indicator
FOOTPRINTS
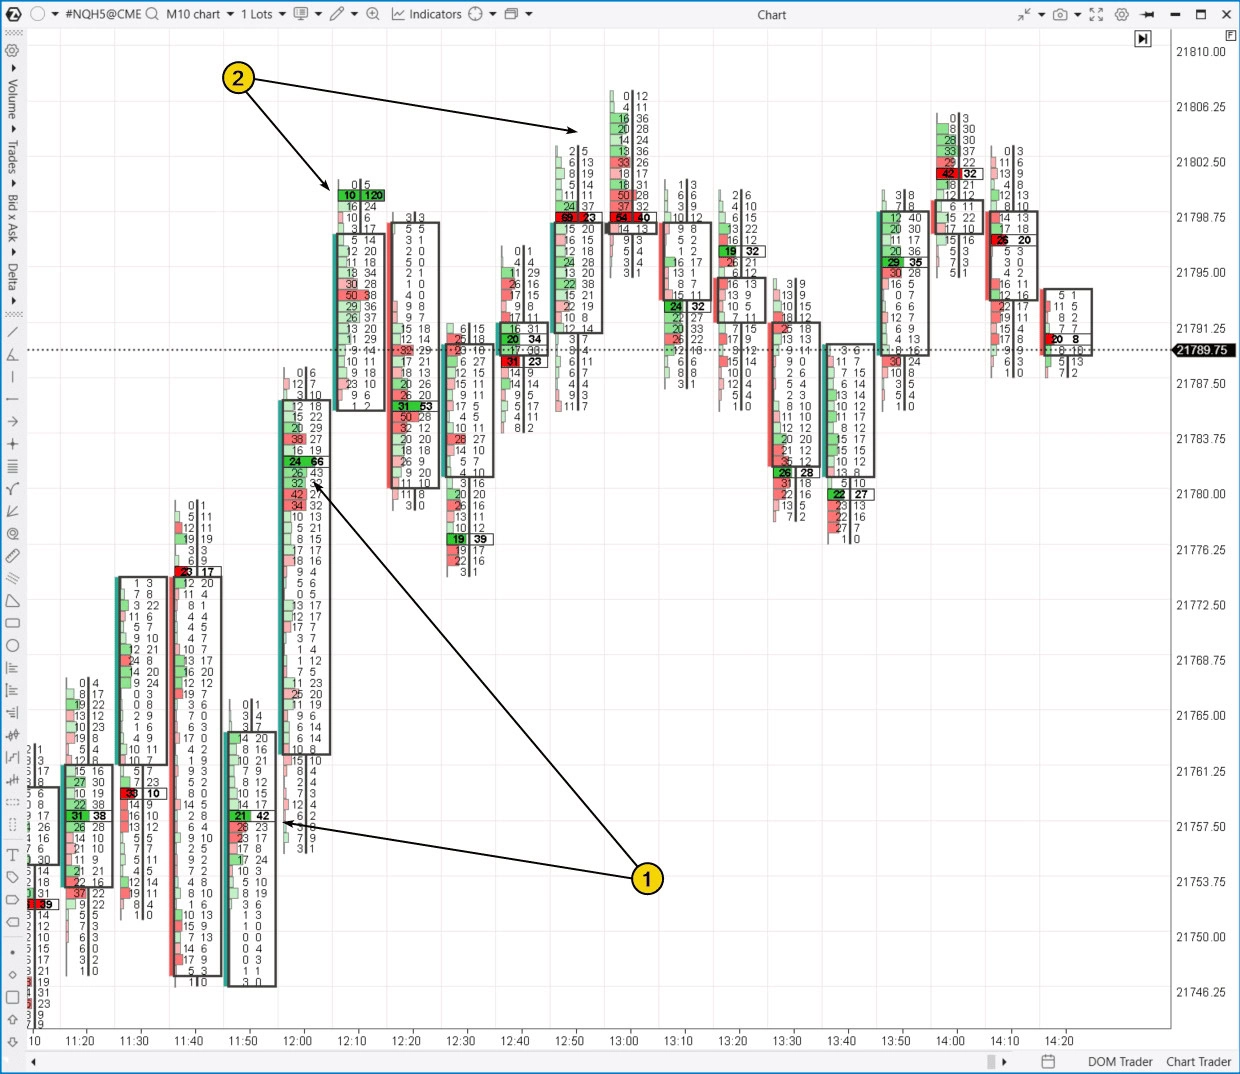
A Footprint is not a conventional indicator but rather a special type of chart (also known as a cluster chart). It combines horizontal and vertical volume data, displaying them directly within each candle. This format allows for detailed analysis of volume structures at different price levels.
📌 Example. 10-minute cluster chart of the E-mini Nasdaq 100 futures index.
Footprints and Their Role in Price Analysis
Footprint charts allow traders to visually assess the interaction between price and trader actions:
1️⃣ Buyers were effective. Their executed market-buy orders (visible in green clusters) predominantly led to a price increase. Often, the accumulation of such clusters serves as support levels in the future.
2️⃣ Buyers were not effective. Despite the fact that market-buy orders were executed, the price declined – this is a bearish signal.
VWAP
📊 TWAP (Time-Weighted Average Price) and VWAP (Volume-Weighted Average Price) – two popular indicators that help traders evaluate an asset’s average price over a specified time period. They allow traders to:
✅ Identify price deviations from average values.
✅ Analyze trend strength and direction (or its absence).
✅ Determine key support and resistance levels.
💡 On the ATAS platform, both tools are combined into a single VWAP/TWAP indicator, which simplifies their use in trading.
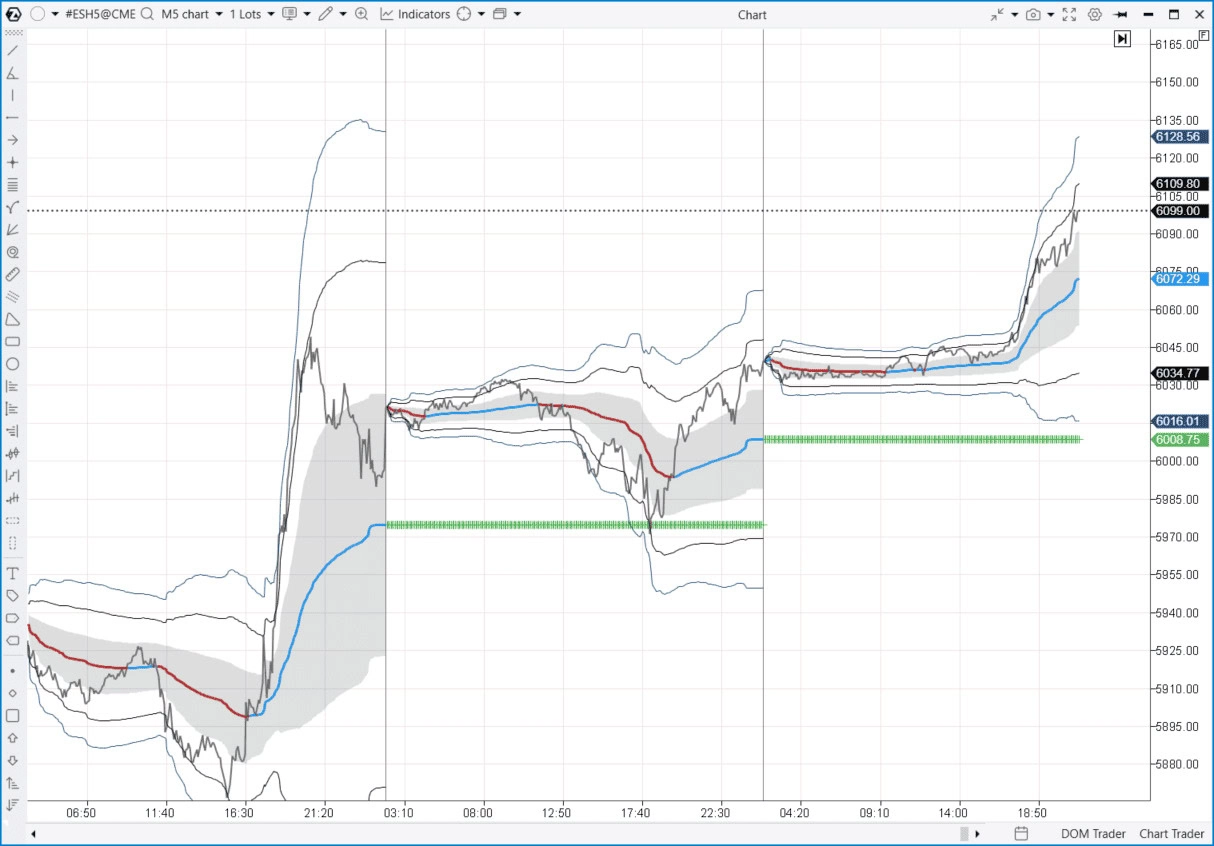
📌 Example. The screenshot below shows how the VWAP indicator appears on the chart of the ES – E-mini futures contract for the S&P 500 stock index.
DEPTH OF MARKET AND HEATMAP
Depth of Market (DOM, Depth of Market) is an indicator that displays real-time data on limit orders for buying and selling, placed in the order book. Traders use it to analyze liquidity as well as the balance of supply and demand in real-time. To work with DOM, a connection to the exchange data feed is required.
Heatmap (DOM Levels) is an indicator that visualizes how the volume of limit orders has changed over time at different price levels on the chart. It allows traders to identify patterns in price interactions with levels where large orders were placed and to detect key support and resistance levels.
Example:
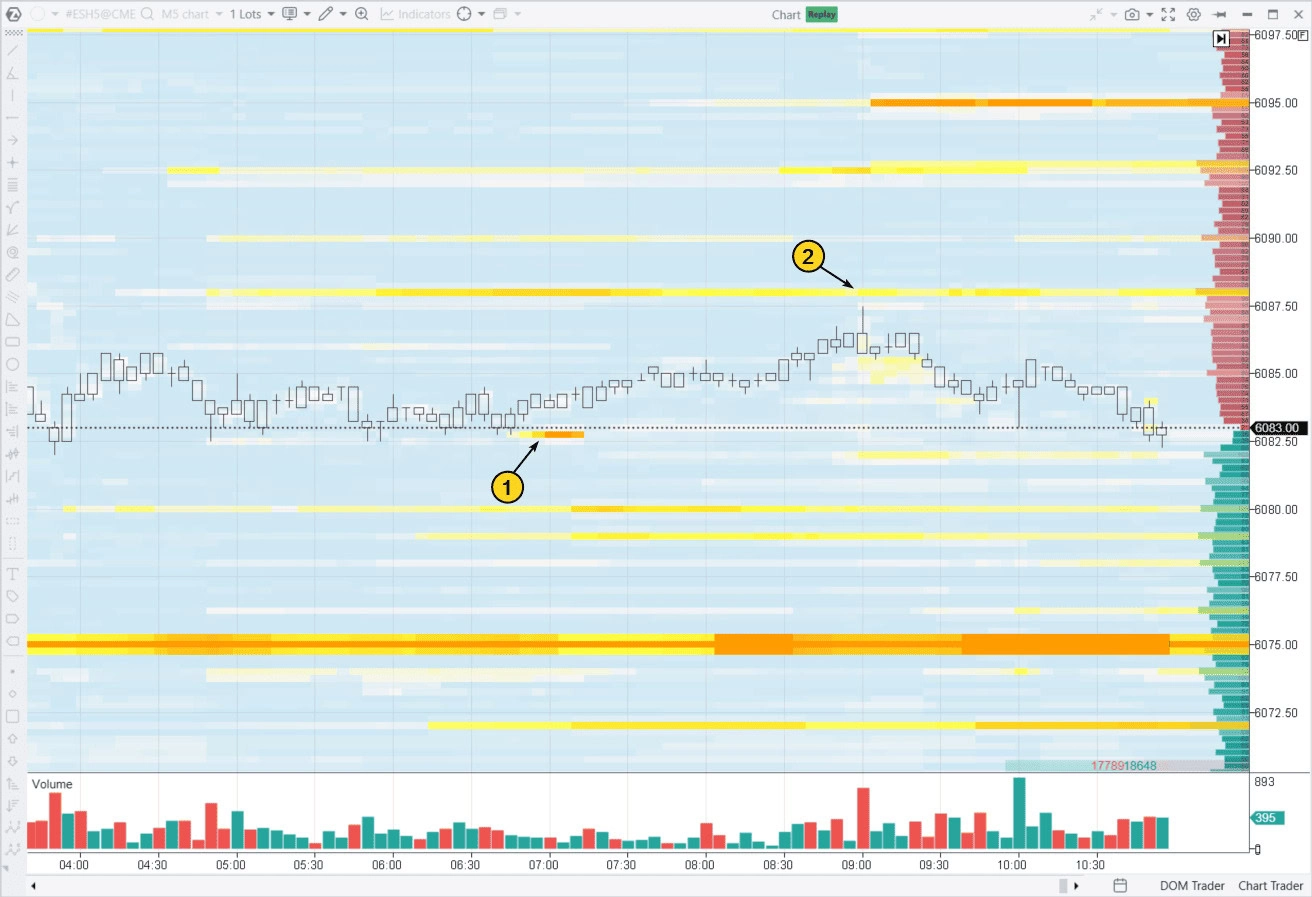
The example below illustrates how these two volume indicators appear on an ES futures chart:
- The depth of market is displayed as a red-green histogram: the larger the histogram bar, the higher the total volume of limit orders placed at that level.
- The heatmap in the price area visualizes volume changes over time. Bright “hot” colors at certain levels indicate an increase in order book volume.
Analyzing limit order volumes helps to understand how liquidity in the order book affects price movements. For example:
- A significant volume of limit buy orders (1) provided a bullish impulse to the market;
- After that, the price moved up to level (2), where large volumes of limit sell orders were observed. This level acted as resistance.
OTHER VOLUME INDICATORS
The ATAS platform offers more than 200 indicators for trading, with the most valuable tools being those for volume analysis.
In addition to the already mentioned indicators, traders may find the following useful:
- Cluster Search — a volume indicator that allows finding clusters on the footprint chart that meet specific criteria. For example, a cluster located at the tail of a candle with market-buy volume exceeding 20 contracts.
- Big Trades — this volume indicator highlights large trades on the candlestick chart, helping to analyze their impact on price.
- Tape Patterns — this indicator analyzes the flow of transactions and identifies large trades that match specific criteria. While its setup may be complex, it provides unique opportunities for in-depth market analysis.
- Cluster Statistic — this indicator displays data in table format, showing volumes (number of bids, asks, delta), as well as time and other parameters for each candle.
HOW TO INTERPRET VOLUME INDICATOR SIGNALS
Understanding volume indicators is challenging. Their signals are not as straightforward as moving average crossovers. The difficulty lies in the need to interpret volumes—this requires taking market context into account, understanding the logic behind supply and demand laws, and analyzing the chart structure.
Even experienced analysts, despite years of studying the relationship between price and trading volumes across different assets, often find it difficult to confidently assess the current market state and predict future price movements.
Example:
You notice high volume. What does this mean? It could indicate the beginning of a strong trend or its completion. It could also represent an accumulation or distribution phase.
How do you determine whether the price increase is driven by large players or by the liquidation of positions? If the delta shows buying activity, who is behind it? Retail traders chasing momentum, or professional market participants who often take profits at such price movements?
This is why interpreting volume requires attentiveness and experience—just glancing at a volume chart does not always provide clear answers.
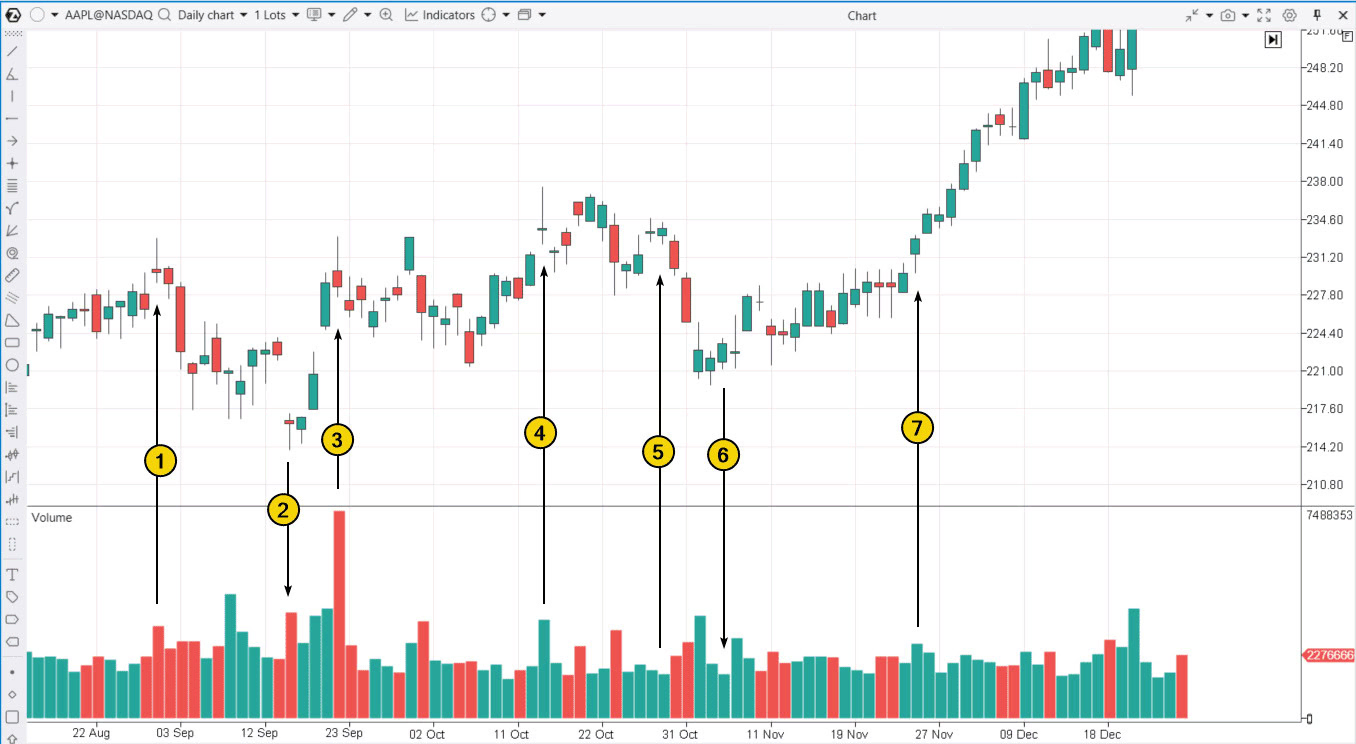
Chart 1: Apple (AAPL) stock on the daily timeframe.
Trend Confirmation
Classic trend confirmations include the following signals:
- An increase in vertical volumes when the price moves in the direction of the main trend, for example, buyers’ activation in an uptrend.
- A decrease in vertical volumes when the price moves against the main trend, for example, in an uptrend, this may indicate weak selling pressure.
Example:
On November 25, AAPL trading (7) opened with a bullish gap at the month’s highest point, closing with a price increase and higher volume. This is a bullish signal, confirming the idea that the long-term uptrend (measured in weeks and months) is gaining strength.
Weakening Pressure
A decline in vertical volumes can provide valuable insights into a lack of interest from one side at current price levels, for example:
- After a period of price growth, a drop in volume on a bullish candle may indicate that buyers are unwilling to pay excessively high prices for the stock.
- Decreasing volumes on a bearish candle following a price decline indicate that sellers have reduced pressure.
Examples:
- Decreasing trading volumes in AAPL (5) in late October 2024 signaled weak demand around the $233 level. The subsequent price drop over several days confirmed this interpretation.
- A decline in AAPL (6) trading volumes in early November 2024, after multiple days of price decline, indicated weakening seller pressure near the $222 level. The following price increase alongside higher volumes confirmed this.
Bullish and Bearish Signs
Let’s analyze how the vertical volume indicator changes during price increases (for price decreases, the reverse patterns apply):
Bullish Signs:
✔ Volume rising above average values → indicates demand activity.
Important conditions:
- The candle should not be narrow.
- The candle should close near its high.
Bearish Signs:
✔ Volume below average values during price growth attempts → signals weak demand and a lack of buyers. Candles may take the form of a Doji, indicating uncertainty.
✔ Excessively high volume on bullish candles → may indicate a FOMO effect, where traders jump into the market at a peak, potentially leading to a reversal.
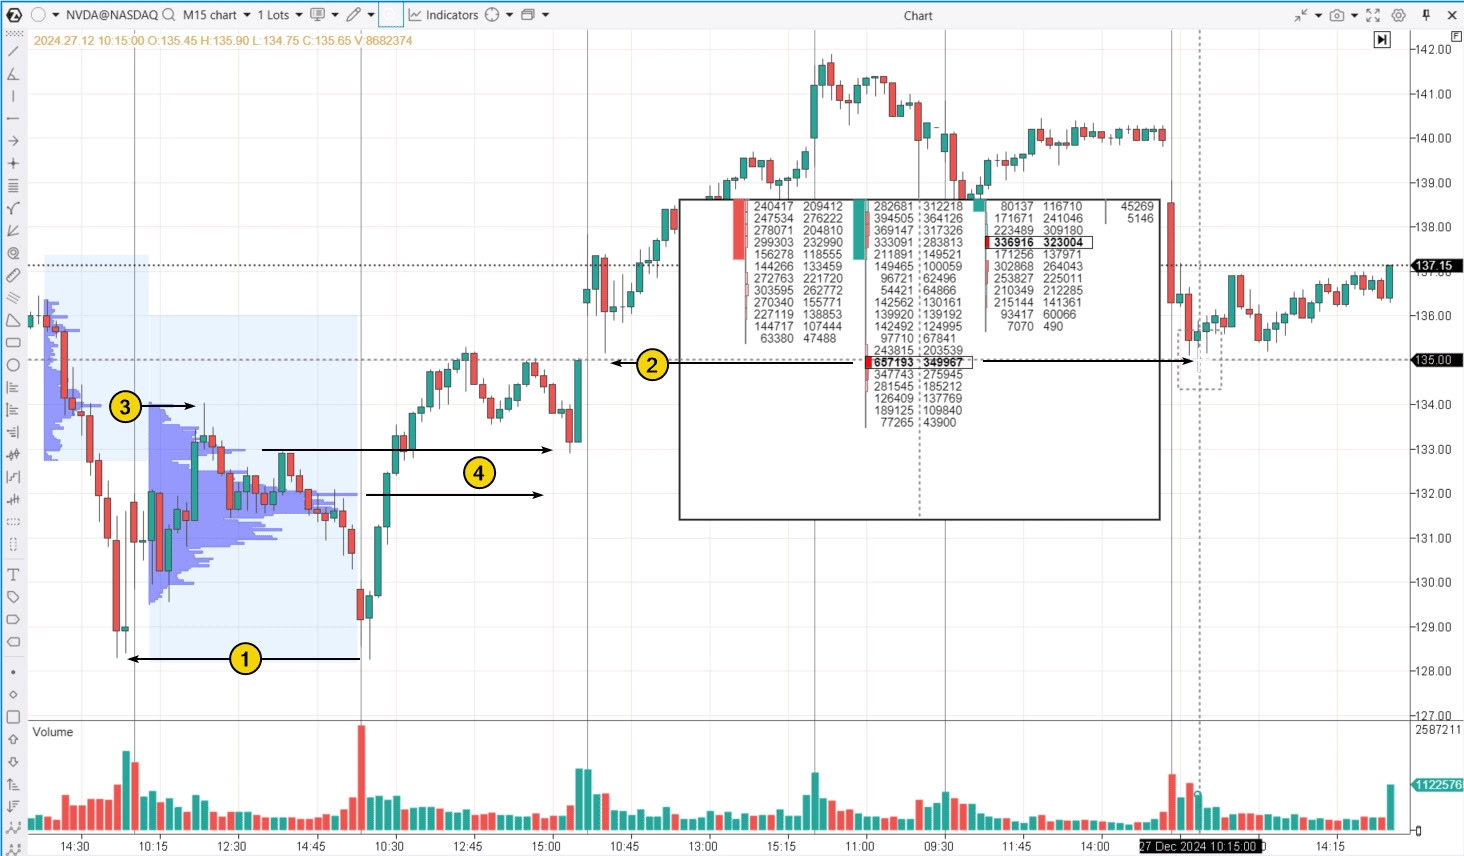
Examples on NVDA Stock Chart:
- The price failed to break above $134, which acted as resistance (3). This bearish signal could have been used by traders to open short positions intraday.
- The price rose above the previous day’s high-volume levels (4) and remained there – a bullish signal.
Volume Indications for Trend Reversals
Volume indicators often provide crucial signals about possible trend reversals, reflecting price movement changes.
Examples:
- August 29, AAPL – rally culmination (1).
- September 16, AAPL – a relatively narrow candle closing in the upper part with increased volumes (2) suggests the following market behavior: after a bearish gap, sellers panicked and rushed to sell the stock, but strong buying interest absorbed the offers and prevented a price drop – a bullish signal. A price reversal followed.
- September 20, AAPL – situation (3) resembles the mirror image of the reversal on candle (2), but with a false breakout of the previous high (1).
- October 15, AAPL – a narrow candle with a bullish gap and a closing in the lower part on high volumes (4) indicates that a significant interest is selling the stock, utilizing a demand spike (possibly due to “bullish” news), preventing the price from increasing past the opening level.
Volume Indications on Breakouts
A breakout is a signal that the price has moved beyond the previous range. It can be genuine, signaling the start of a strong movement and a potential entry point, or false, when the price quickly reverses, creating so-called bull and bear traps. False breakouts occur more frequently and often lead to sharp reversals.
Examples of False Breakouts on NVDA Chart:
- At the start of the trading session, amid high volatility, the price briefly dropped below the previous day’s low (1) but closed higher – a signal favoring a bullish scenario.
- A similar situation occurred later when the price initially dropped below the level of a previous day’s low (2). The ATAS Magnifier indicator (press “M” to activate) helps examine this moment in detail. Closing above $135 indicates the likelihood that this is a bullish signal.
![]()


