MICROSOFT INITIAL PUBLIC OFFERING (IPO)
⇒ Warning. Any strategy does not guarantee profit on every trade. Strategy is an algorithm of actions. Any algorithm is a systematic work. Success in trading is to adhere to systematic work.
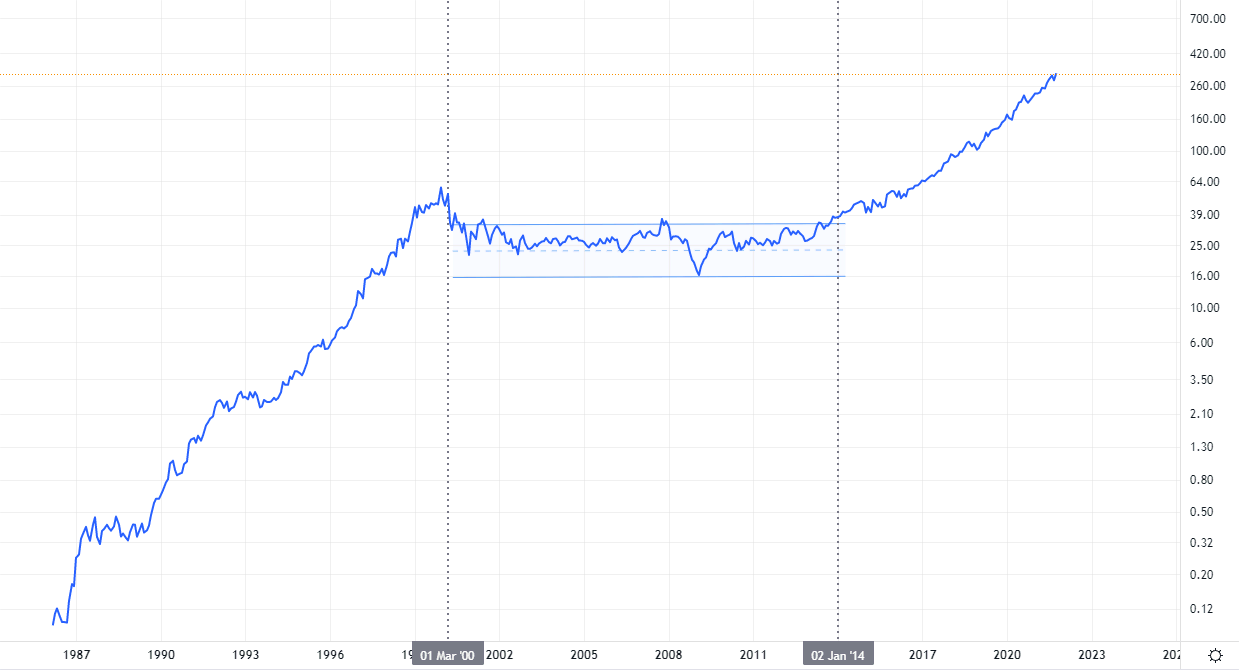
The Microsoft company had its IPO on March 13, 1986. The initial price was USD 21 per share. The market capitalization after the IPO was less than USD 700 million. By today’s standards, it would make Microsoft a company with small capitalization.
There were nine MSFT stock splits in the course of many years. It means that a typical 2:1 split brought stockholders two ‘new’ shares for every old ‘one’ they had held. After that, the stock price is corrected proportionally, so that the investment value stays the same as it was before splitting.
If you bought only one Microsoft share during the IPO at USD 21, you would have 288 shares today after all the splits. If we take quotation at USD 300, the value of all shares would have cost USD 86,400.
Approximately, it means the revenue of about 25% a year or the total revenue of nearly 211,000% excluding dividends.
Microsoft demonstrated phenomenal growth. Its success was based on developing relations with Intel and IBM.
Microsoft developed its own software in the 1970s, which operated properly with the Intel 8086 processor. In 1980, Microsoft executed a deal for delivery of an operating system (known as DOS) for the new IBM PC.
COMPLETE HISTORICAL MSFT STOCK CHART
If we look at the historical MSFT stock chart, we can specify 3 periods.
- There was explosive growth from the IPO until 2000. By the end of the 1980s, Microsoft became the largest developer of software for PCs. The Microsoft co-founder Bill Gates became the youngest billionaire in 1987 when he was 31 years old. He became the richest man in the world in 1995 with a fortune of USD 12.9 billion.
- The stock price entered a long-term range after the dotcom crash.
- MSFT has demonstrated stable growth since the beginning of 2014.
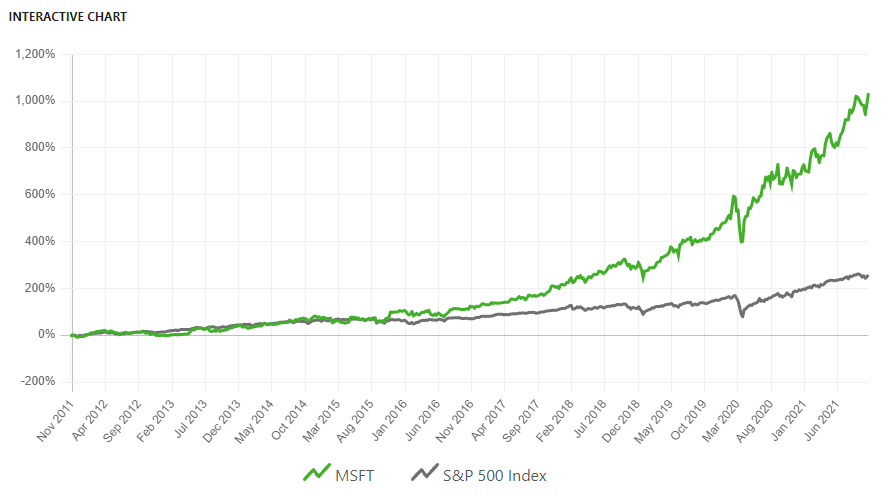
During the past 5 years, MSFT has significantly exceeded the S&P 500 index in dynamics and has been the market leader.
MSFT STOCK DIVIDENDS
Microsoft paid its first quarterly dividends in 2004.
Microsoft announced on September 14, 2021, that the Board of Directors approved an increase of quarterly dividends by 11% bringing them up to USD 0.62 per share.
Microsoft also approved a new stock buyback program which allowed it to spend up to USD 60 billion. The buyback program doesn’t have its date of expiry and can be terminated at any time.
If you want to learn the current size of dividends and other data about MSFT stock, you can use various sources of financial information.
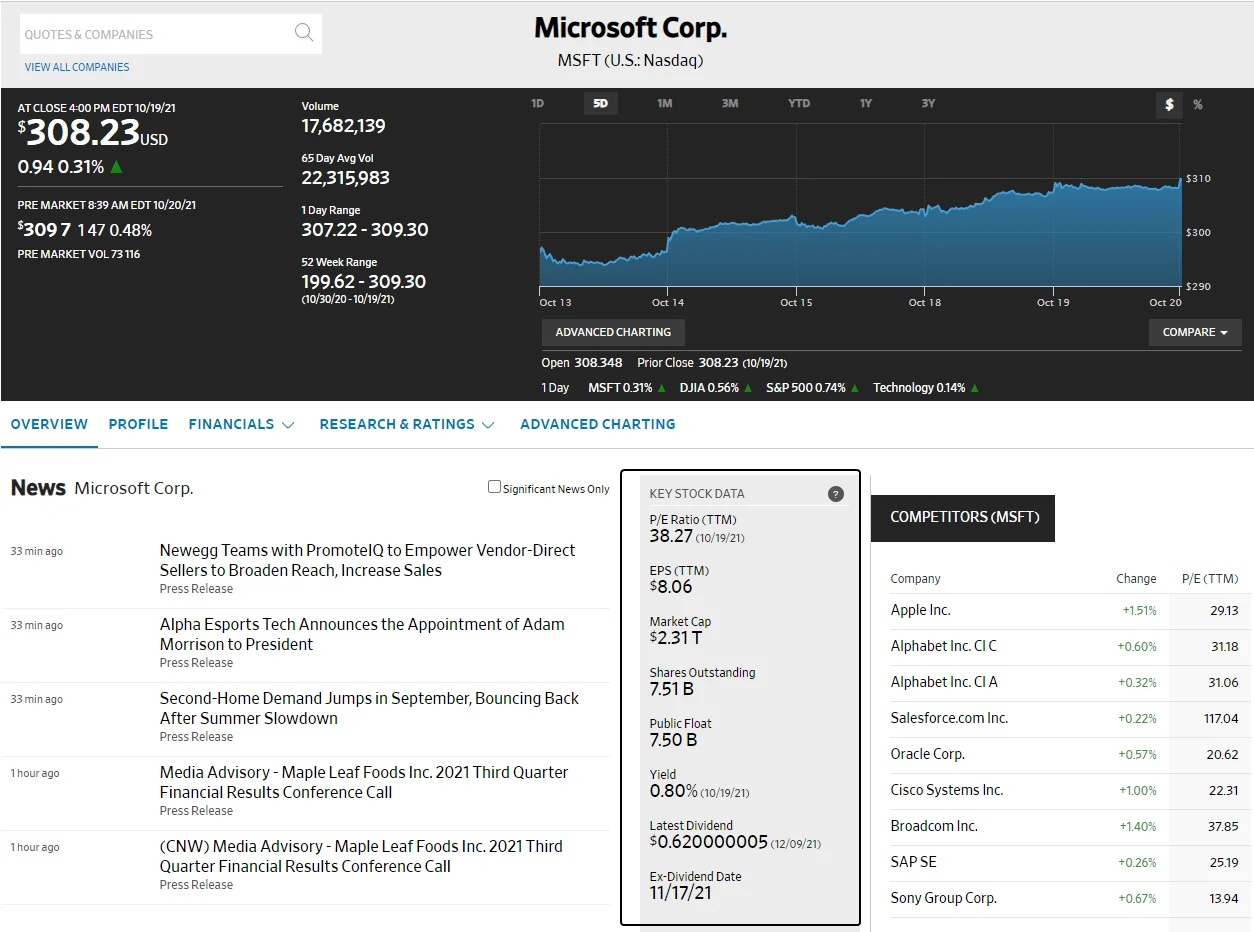
For example, Wall Street Journal – namely, the Microsoft page:
This page provides fundamental MSFT stock indicators (at the moment of writing this article):
- P/E Ratio (TTM) = 38.27.
- EPS Ratio (TTM) = USD 8.06.
- MSFT market capitalization = USD 2.31 trillion.
- MSFT stock in circulation = 7.51 billion.
According to the company reports, its revenue is constantly growing.
Other sources of the MSFT stock fundamental data:
HOW MICROSOFT MAKES MONEY
Microsoft noted in its reports that COVID-19 pandemic influenced its business operations and financial results in the 2021 financial year:
- Net profit increased by 38.4% up to USD 61,300 million.
- Annual revenue increased by 17.5% up to USD 168.1 billion.
- Operating income increased during one year by 32.0% up to USD 69.9 billion.
The company marked the growth of demand on cloud services since the pandemic accelerated digital transformation for many enterprises. Microsoft also faced a permanent demand on PCs and instruments for increasing efficiency and also with active interaction with a gaming platform in view of switching to teleworking and activity of the self-isolated population.
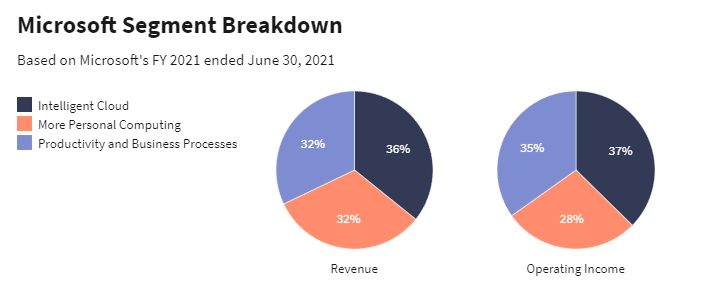
Microsoft splits its business in three segments, each of which has approximately the same share:
- Intelligent Cloud.
- More Personal Computing.
- Productivity and Business Processes.
These segments are classified both by the product type and demographic composition of consumers.
The Productivity and Business Processes segment includes a portfolio of products designed for increasing corporate efficiency, communication and information services. One of its main products is the Microsoft Office software package, which includes both commercial and consumer subdivisions. The segment also includes business solution products, such as the LinkedIn professional contact network.
In the 2021 financial year, the revenue from efficiency and business processes constituted USD 53.9 billion, which is 32% of the total Microsoft income. It is 16.2% more than last year.
The Intelligent Cloud segment includes all Microsoft publicly available, private and hybrid server products and also cloud services for business. They include Microsoft Azure, SQL Server, Windows Server, GitHub, Enterprise Services and others.
In the 2021 financial year, Intelligent Cloud brought revenue in the amount of USD 60.1 billion, which was nearly 36% of the total revenue. Intelligent Cloud grew by 24.2% from the previous year and became the most fast-growing annual income segment.
Microsoft describes its More Personal Computing as a segment consisting of products and services directed at ‘focusing our technologies on our customers’. This segment includes the Windows operating system, Surface device and game products.
In the 2021 financial year, the More Personal Computing segment brought revenue in the amount of USD 54.1 billion.
GROWTH STRATEGY
Satya Nadella replaced Steve Ballmer on February 4, 2014, becoming the third Microsoft Director General.
The company had serious problems at that time:
- The Windows operating system and Office software continued to bring a lot of money but more and more users kept old versions instead of buying updates.
- The Azure cloud platform was much smaller than Amazon Web Services and new Office 365 cloud services faced a strong competition on behalf of Google Alphabet.
- Microsoft Windows Phone lost the mobile market to iPhone from Apple and Android devices from Google and the company undertook the final effort to save the product by buying a Nokia mobile phone subdivision.
- The Xbox One console emerged at the end of 2013 and also gave way to PS4 from Sony in the gaming market.
In order to solve the problems, Satya approved the ‘Mobile First, Cloud First’ strategy.
Instead of getting money from profitable Windows and Office, Nadella focused on converting them into cloud services for attracting a bigger number of customers. Microsoft launched Windows 10 as a free update for the majority of its Windows users, monetized the platform, expanding its application integrated store, and expanded Office 365, which later was renamed into Microsoft 365, converting it into a stable ecosystem based on subscription.
Microsoft went back on the former Nokia mobile phone subdivision and focused on development of more advanced applications for iOS and Android. The company also actively expanded Azure by means of investments, acquisitions and partner relations in order to catch up with AWS.
As a result, the Microsoft Compound Annual Growth Rate (CAGR) was 7.9% during the period from 2007 until 2014. However, the CAGR was 9.9% during the period from 2014 until 2021 financial year.
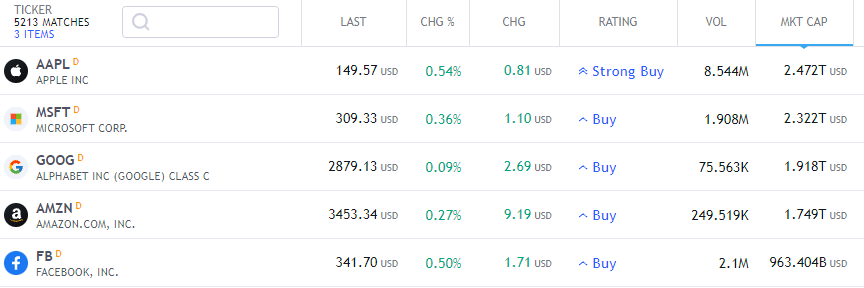
Nadella’s strategy increased the Microsoft market capitalization from approximately USD 300 billion in 2014 up to about USD 2.3 trillion, which makes it one of the most valuable technology companies in the world and second one by market capitalization after Apple (as of the end of October 2021).
HOW TO SEE QUOTATIONS
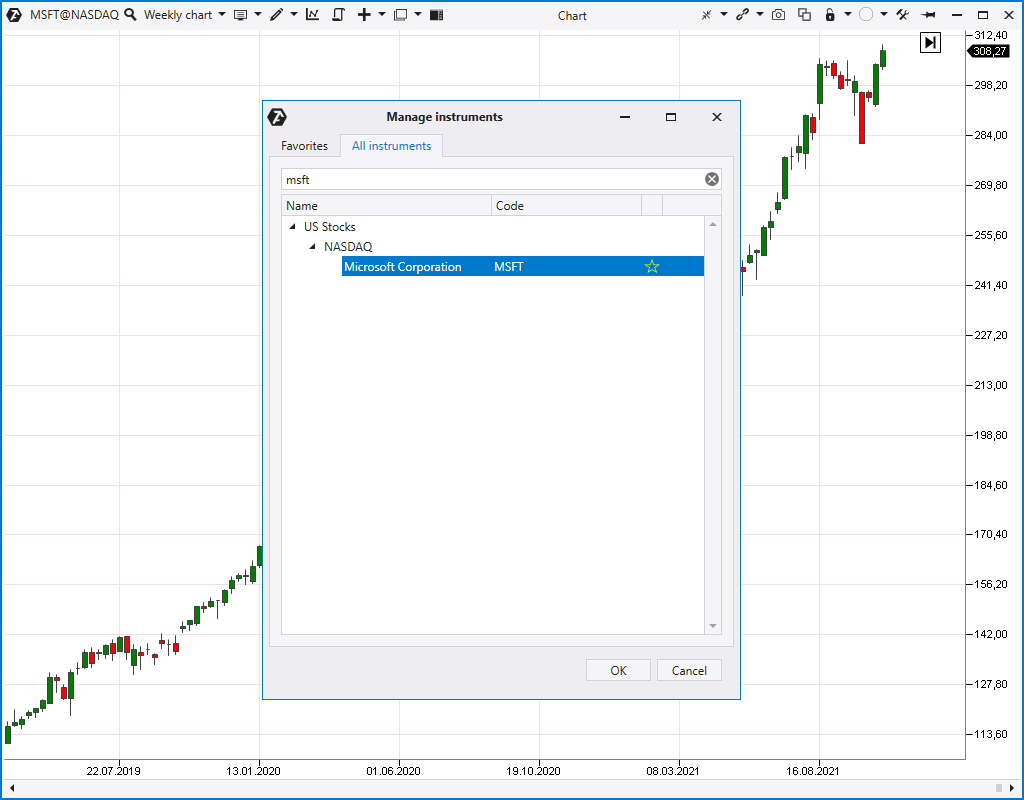
In order to see the MSFT stock chart and the most recent quotation on your computer screen, make the following 3 steps:
- Download the ATAS platform.
- Install and launch it.
- Open the Chart window, enter MSFT in the instrument selection field and press OK.
Everything is ready!
Advice. We recommend that you subscribe to data providers from the NASDAQ stock exchange to get high-quality data.
HOW TO ANALYSE THE MSFT STOCK CHART
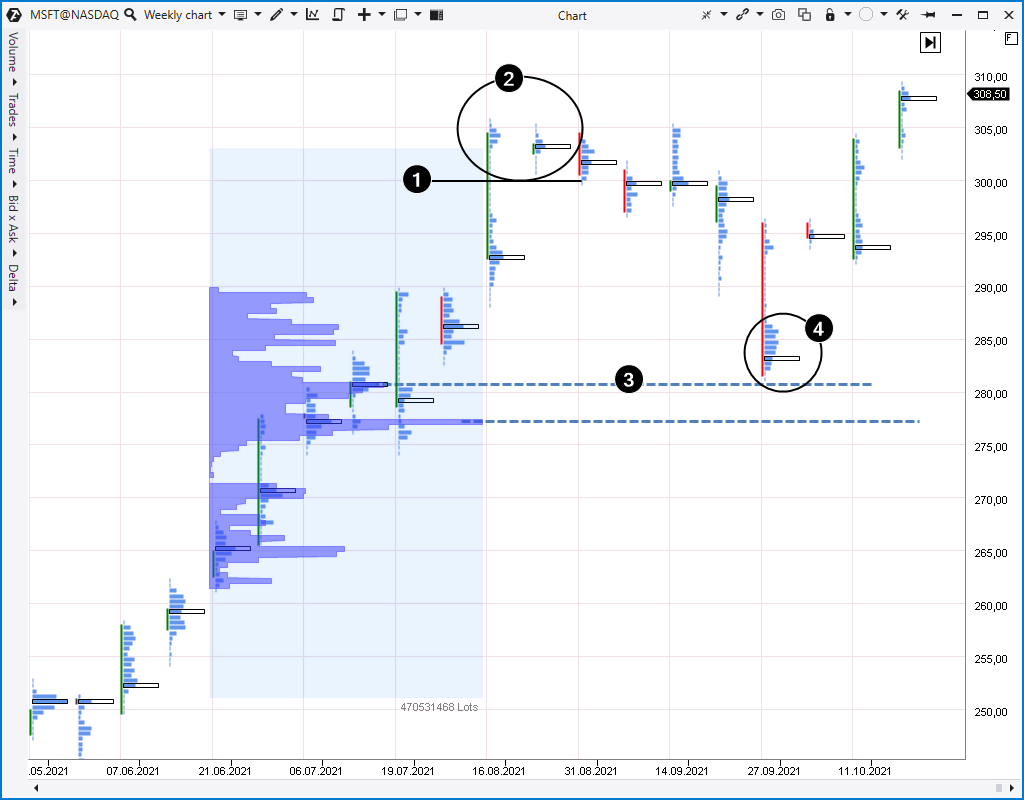
Use cluster charts to select the best point of entry into the market. They help to understand real trading processes, which take place in the MSFT stock market, better.
For example, the above weekly chart shows the following:
- The price exceeded the round level of USD 300.
- Later on, the growth ‘slowed down’ and volumes formed several ‘bulges’. The reason could be that the price failed to consolidate above 300. Maximum volume levels moved down every week and this gave a reason either to register profit from the earlier buys or even enter into a short position hoping for a relatively small correction which later really took place.
- The price went down to high volume levels near USD 280 per share and an arbitrary Market Profile helps to find them.
- A new bulge gives a reason to assume that the price found support after a fast decrease and ‘doesn’t want’ to move further in the bearish manner. The subsequent up-gap deprived those, who were in doubt and were looking for additional confirmations, of the opportunity to buy the stock at a good price. The last price surpassing the 300 level looks like a better prepared one. Most likely, the price will be able to consolidate there as opposed to the first effort.
MSFT STOCK PRICE FORECASTS
At the end of the article, we will offer you Wall Street analyst forecasts for the future stock price. A majority of the analysts see the company stock rally continuation under the leadership of Satya Nadella since Azure, Microsoft 365, Dynamics and other cloud services will receive more users. Windows will continue to develop, it will produce more devices for convertible PCs, games and augmented reality markets and its dependence on traditional PCs will become weaker.
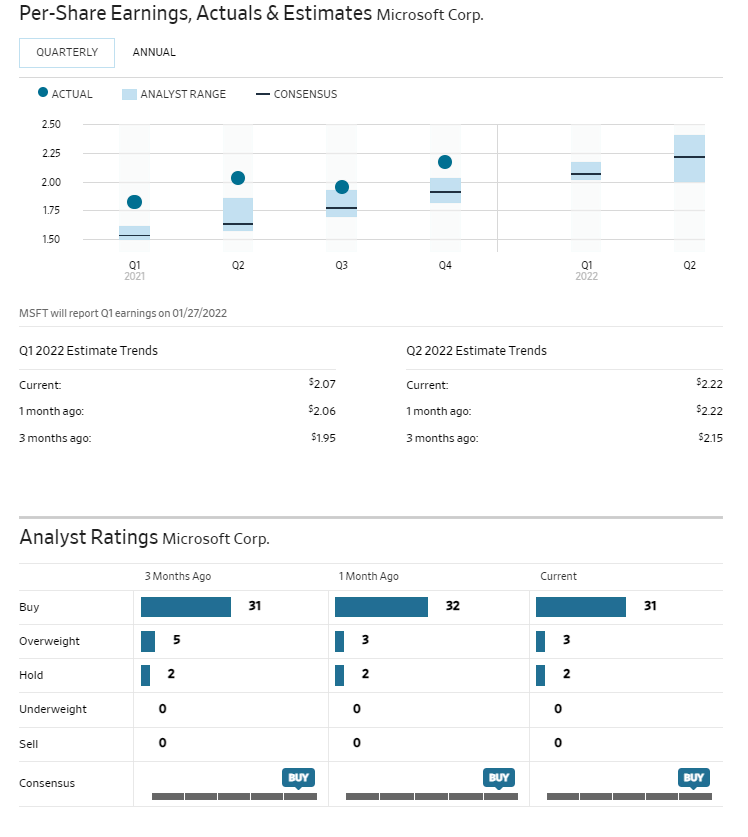
According to Wall Street Journal, analysts regularly increase their forecasts for Microsoft financial results but the company regularly exceeds them.
That is why, the definite rating is BUY.
It might well be that the Microsoft stock can double or triple during the forthcoming decade. The company keeps facing a big number of strong competitors in its main markets, however it moves ahead of the technology curve and not behind it.
BT
![]()
