


⇒ Warning. Any strategy does not guarantee profit on every trade. Strategy is an algorithm of actions. Any algorithm is a systematic work. Success in trading is to adhere to systematic work.
THE SIGNIFICANCE OF ORDER BLOCKS IN TRADING
Order Block is a pattern that occurs at price reversal points. It can be either Bullish Order Block or Bearish Order Block.
Although ICT (Inner Circle Trader) prefers not to trade cryptocurrencies, his patterns are applicable on all timeframes across forex, stocks, and commodities markets.
Definition of ICT Order Block
A Bullish Order Block is formed from a bearish candle, provided the following three conditions are met:
-
✔ This bearish candle is the lowest of all bearish candles formed during the downward price movement.
-
✔ The close of this bearish candle is near the low (in the lower half of the candle).
-
✔ A support level is nearby (though sometimes this condition is omitted).
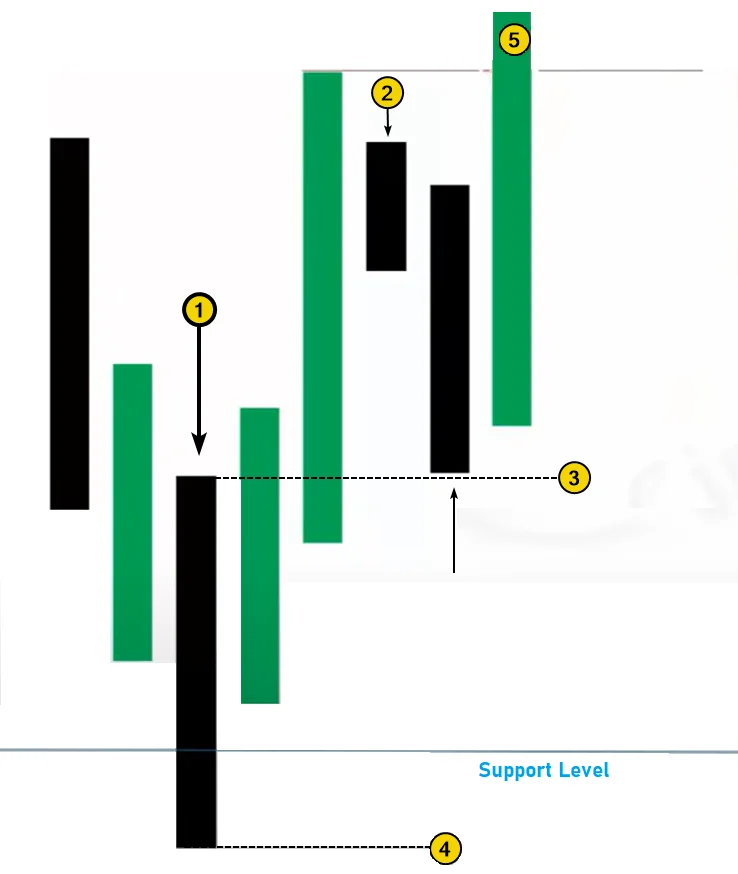
The screenshot below, provided by ICT, schematically shows how a Bullish Order Block is formed.
The bearish candle is marked with Arrow #1:
-
to the left of it is a period of price decline;
-
then price reverses upward from the Support Level.
An area is extended to the right from this candle — this is referred to as the Order Block.
How to Trade Order Blocks
Order Block trading rules are quite simple. Let’s look at an example of a Bullish Order Block as shown in the schematic above.
A long entry signal appears when the following conditions are met:
-
After the formation of the Order Block, the price rises. The candle marked with the number 2 is entirely above candle 1 (its upper boundary is marked as level 3).
-
The price then retraces to level 3, which creates a trade signal to enter a long position.
-
A stop-loss is placed below the Order Block (marked as level 4).
-
The take-profit is placed above the local high (5). More ambitious targets can also be used.
The same logic applies in reverse for a Bearish Order Block.
In essence, an Order Block (OB) is a support/resistance area extended rightward from a bearish or bullish candle with a close near the low or high. It signals a potential trend reversal from that support/resistance level.
Example of a Bullish Order Block on a Live Chart
In the screenshot below from the official Smart Money Concept YouTube channel, Michael Huddleston demonstrates his Order Block pattern on the Dollar Index futures chart.
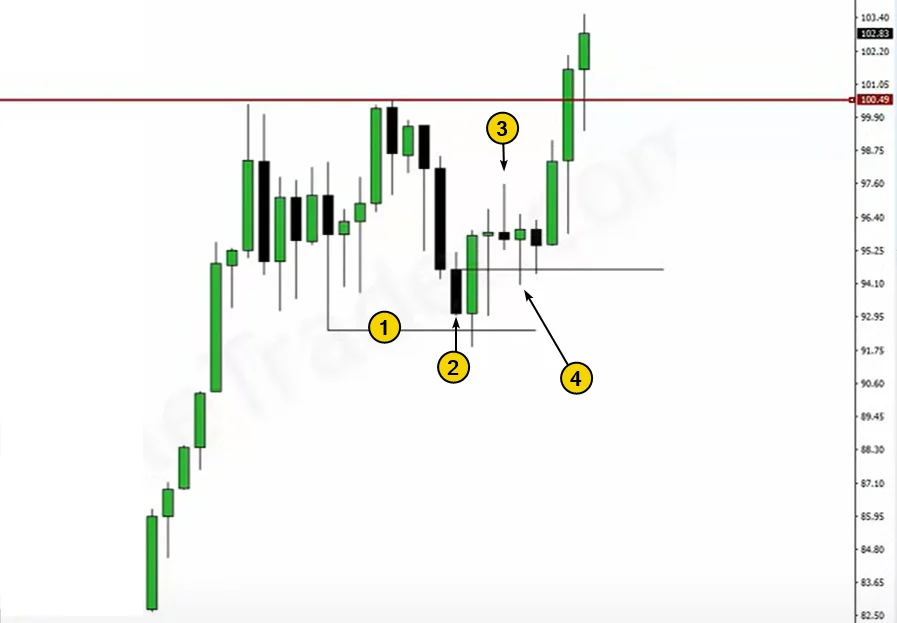
Numbers indicate:
(1) support level based on a significant swing low to the left;
(2) bearish candle from which the Bullish Order Block area is drawn to the right after two consecutive black candles. In this case, the upper boundary of the area is drawn from the candle’s open price, although some sources allow drawing it from the candle’s high.
(3) a candle that closes entirely above the Order Block area acts as confirmation.
(4) a long entry signal is generated when the price retraces into the Bullish Order Block area.
WHY ORDER BLOCKS WORK
Let’s suppose you’re a follower of the Smart Money concept and clearly understand that the price of an asset will rise soon for several reasons, such as:
-
insider information suggests that upcoming economic news will be bullish;
-
analysts believe the asset is objectively undervalued.
You decide to open a long position, but there’s a problem.
The problem lies in the large volume you’re managing. If you enter a long trade at market price, your large buy order will push the price up — which is not favorable.
That’s why you need a downward trend (liquidity from sellers), which you’ll “meet” with limit buy orders (Order Blocks). This increases your chances of entering a large long position near the price low. Buying lows and selling highs — that’s how Smart Money operates.
HOW TO IDENTIFY ORDER BLOCKS USING VOLUME INDICATORS
Although Michael Huddleston (aka ICT) does not use additional indicators in his trading, we will demonstrate that tools like the volume histogram indicator (including the delta indicator) and the market profile indicator can provide valuable confirmations when trading Order Blocks.
Example: The screenshot below shows a Bullish Order Block and Bearish Order Block on a 15-minute euro futures chart:
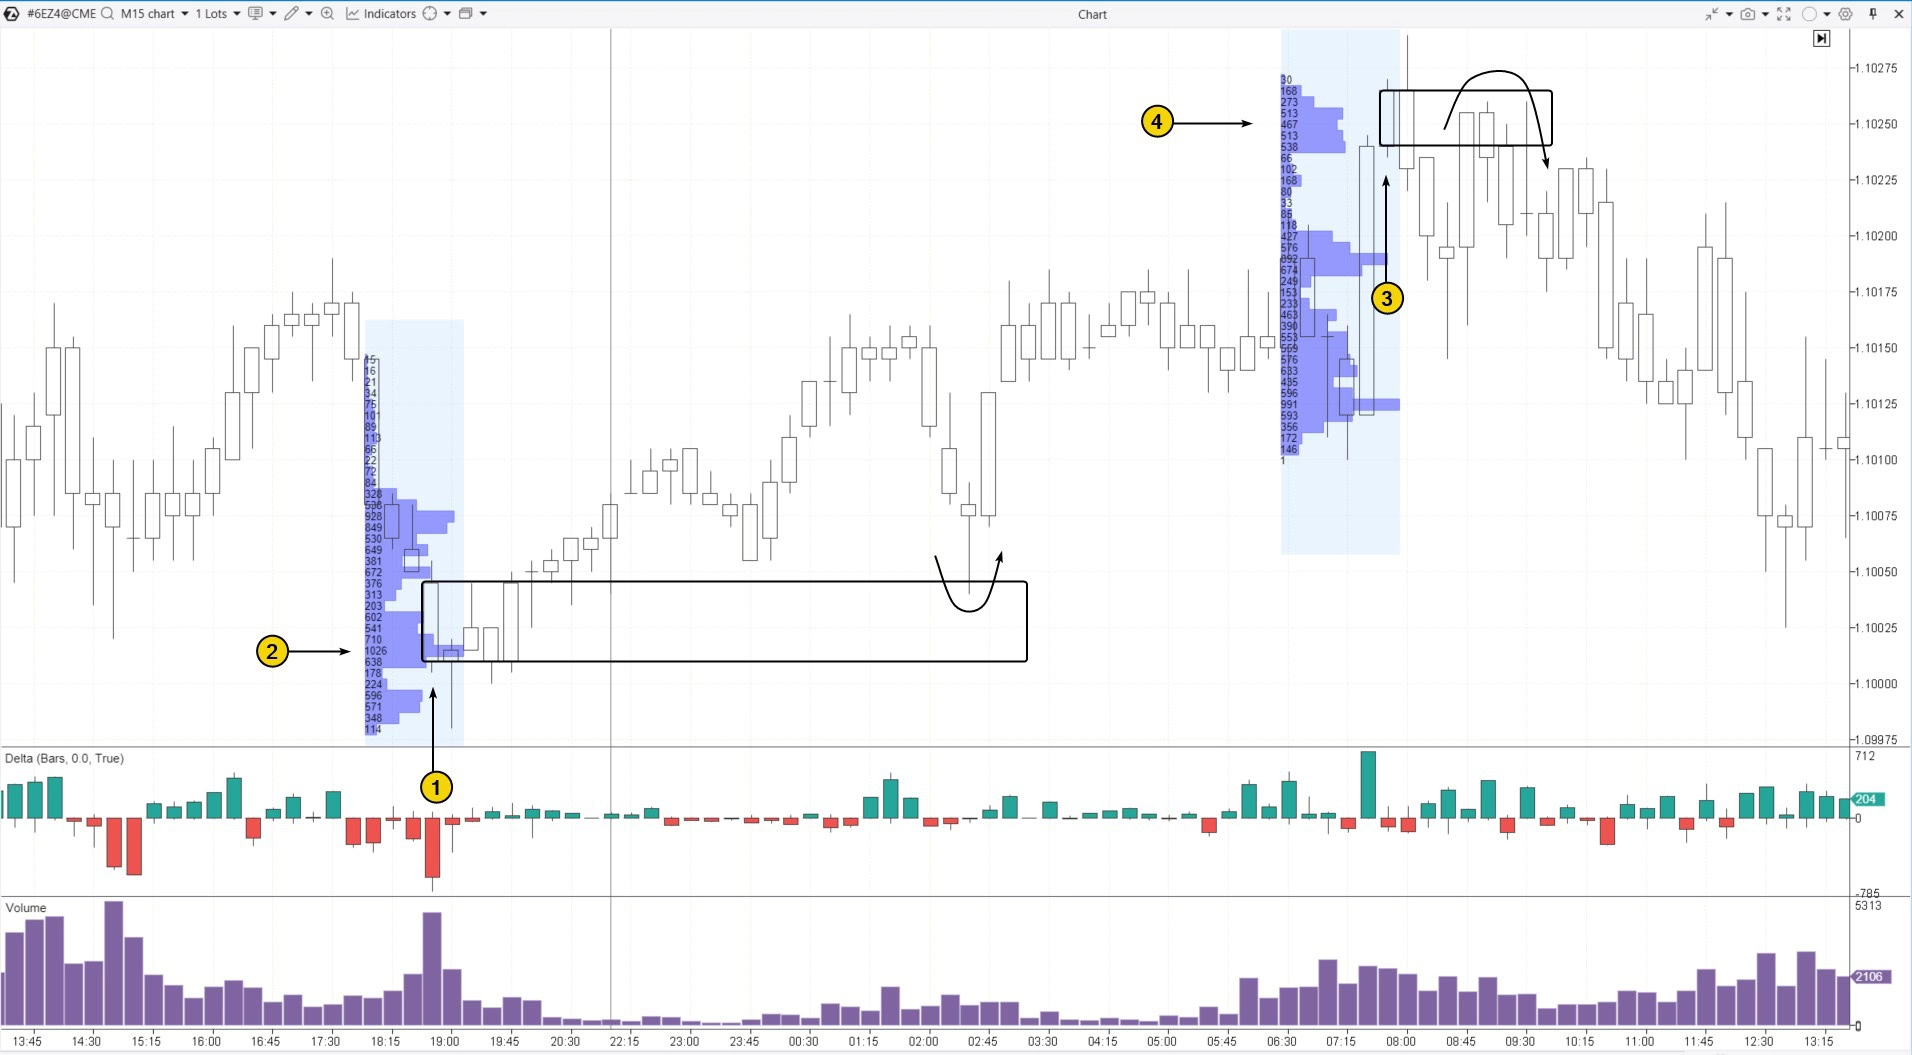
First Order Block — bullish. It was formed as the price declined toward support at the psychological level of 1.10000.
Number 1 marks the bearish candle from which the Order Block support area extends to the right (shown as a rectangle).
Note the spike in negative delta — likely indicating retail traders aggressively sent market sell orders.
It is reasonable to assume that this formed (2) liquidity — suggesting the presence of limit buy orders placed below the market.
Logically, these were Smart Money participants accumulating large positions via limit orders.
After that, the second candle of the bullish pattern forms, and the retest of the Order Block during the 02:30 candle (arrow) could be used as a long entry.
The next pattern is a Bearish Order Block, formed from the candle marked as (3).
In this cluster, traders defend the resistance level, but confirmation can be found through:
-
selling activity (4), indicating filled sell-limit orders placed by informed players (Smart Money), using the liquidity above the level;
-
subsequent price drop below the Order Block over the next two candles.
The signal for short was the return of price into the Bearish Order Block area — a valid setup for entering a short trade.
HOW TO TRADE ORDER BLOCKS USING FOOTPRINT CHARTS
Footprint charts (cluster charts) are among the most informative tools for traders, enabling a detailed analysis of market participant actions.
In the context of the Smart Money Concept, footprint charts help not only identify Order Blocks, but also visually observe how the pattern develops in real time.
Before diving into examples of Order Block trading with footprints, let’s summarize the trading rules for this setup:
ORDER BLOCK TRADING STRATEGY: STEP-BY-STEP ALGORITHM
Step 1: Identify the Pattern.
Look for:
-
a bearish candle near support for bullish setups;
-
a bullish candle near resistance for bearish setups.
Delta, volume profile, or other ATAS indicators can be used to support pattern identification.
Step 2: Confirm the Setup.
This means price begins to reverse and rejects the support or resistance zone.
Step 3: Define Exit Targets.
-
ICT suggests placing take-profits beyond the candle that forms the Order Block.
-
More ambitious targets can be used — for instance, testing a recent swing high/low beyond the Order Block zone.
It is essential to ensure potential rewards exceed the associated risk.
BEARISH ORDER BLOCK ON A FOOTPRINT CHART
Below is an example of a Bearish Order Block pattern formed in early October 2024 on the BNB futures market, using BinanceFutures data.
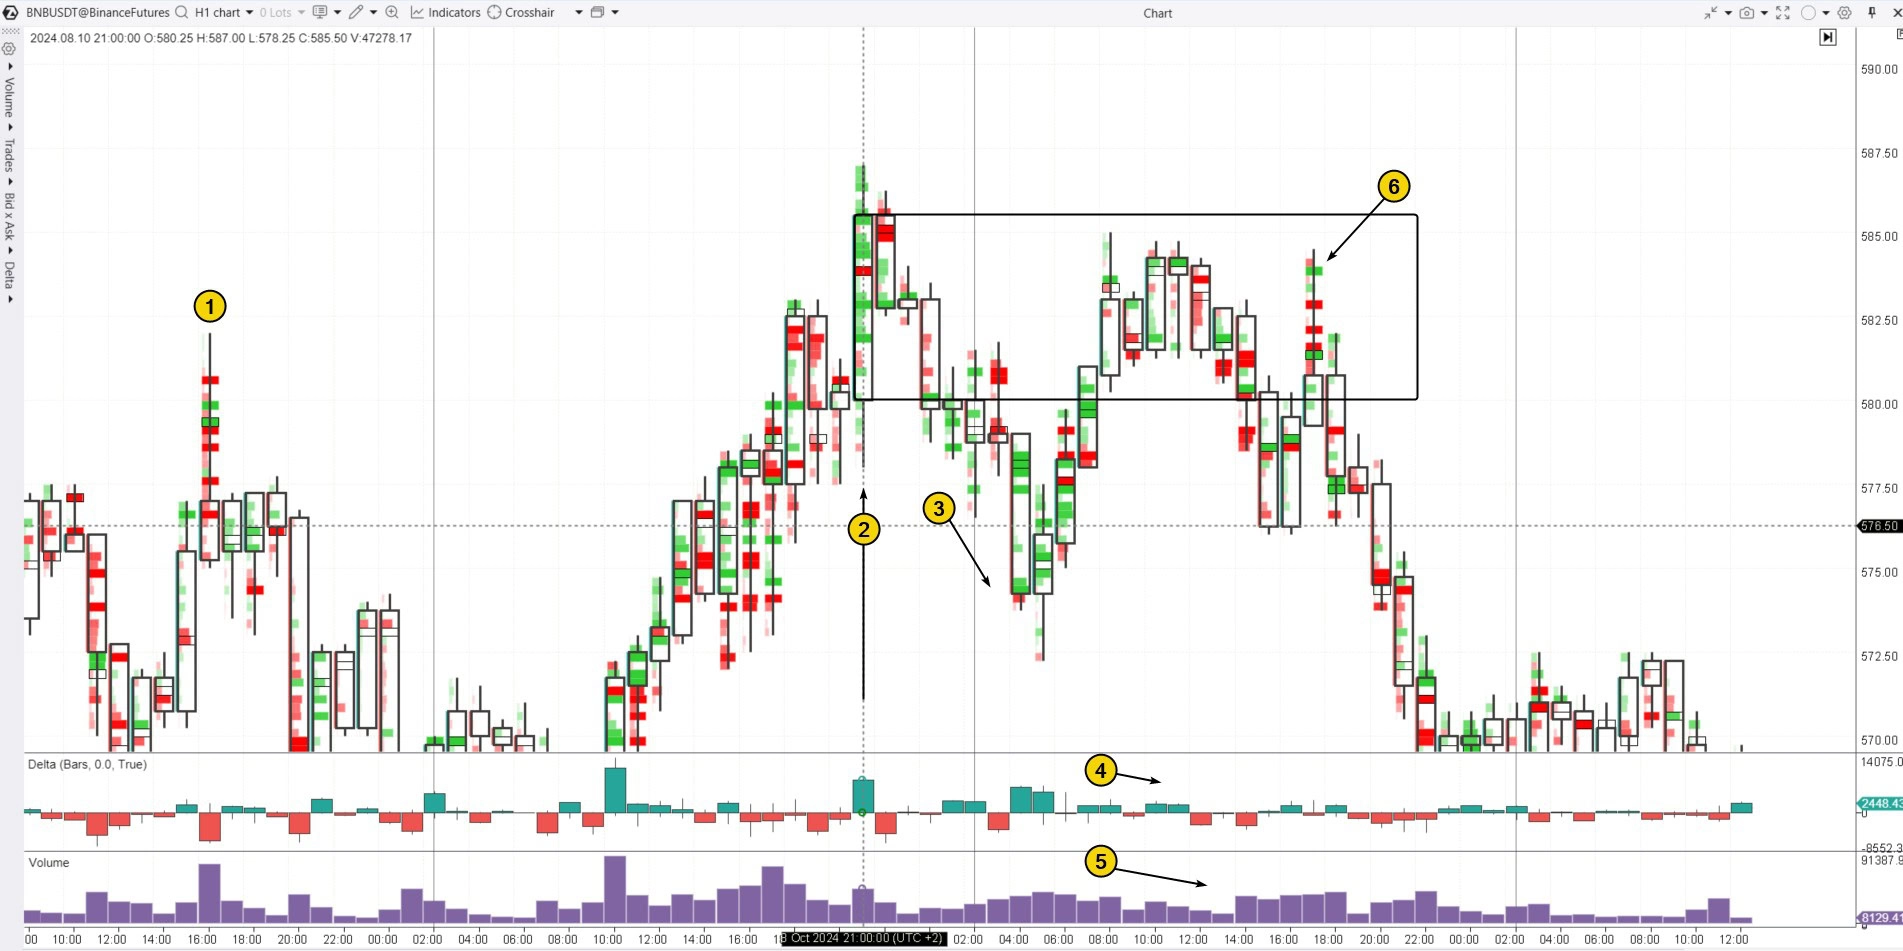
Number (1) marks a local high that indicates a key resistance level. To the left (not visible due to the chart scale), there’s another peak roughly at the same level.
During the attempted breakout of the (1) high, a positive delta spike was observed on candle (2) — this reflects aggressive buying behavior, with traders interpreting the price action as the start of a new bullish trend. The footprint clusters inside the candle are mostly green — this can also be read as “panic” short covering — either manually or by stop-losses.
However, despite the presence of strong market buying, price then drops on candle (3). Why? The burst of market buys represents the liquidity Smart Money needed to fill large sell limit blocks.
This gives us enough basis to:
-
mark the Bearish Order Block resistance zone to the right of candle (2);
-
place a short entry if price retraces into this area the following day.
Further confidence for opening the short comes from volume analysis. Market buying at point (4) is noticeably weaker, and overall volume declines — suggesting that participants are no longer willing to pay a premium for BNB.
A bull trap, or upthrust in VSA terminology — is a classic pattern shown at (6) before the price enters a decline phase.
BEARISH ORDER BLOCK ON AAPL STOCK PRICE CHART
An example of a sell setup based on the Order Block pattern formed in summer 2024 on the daily Apple (AAPL) stock chart:
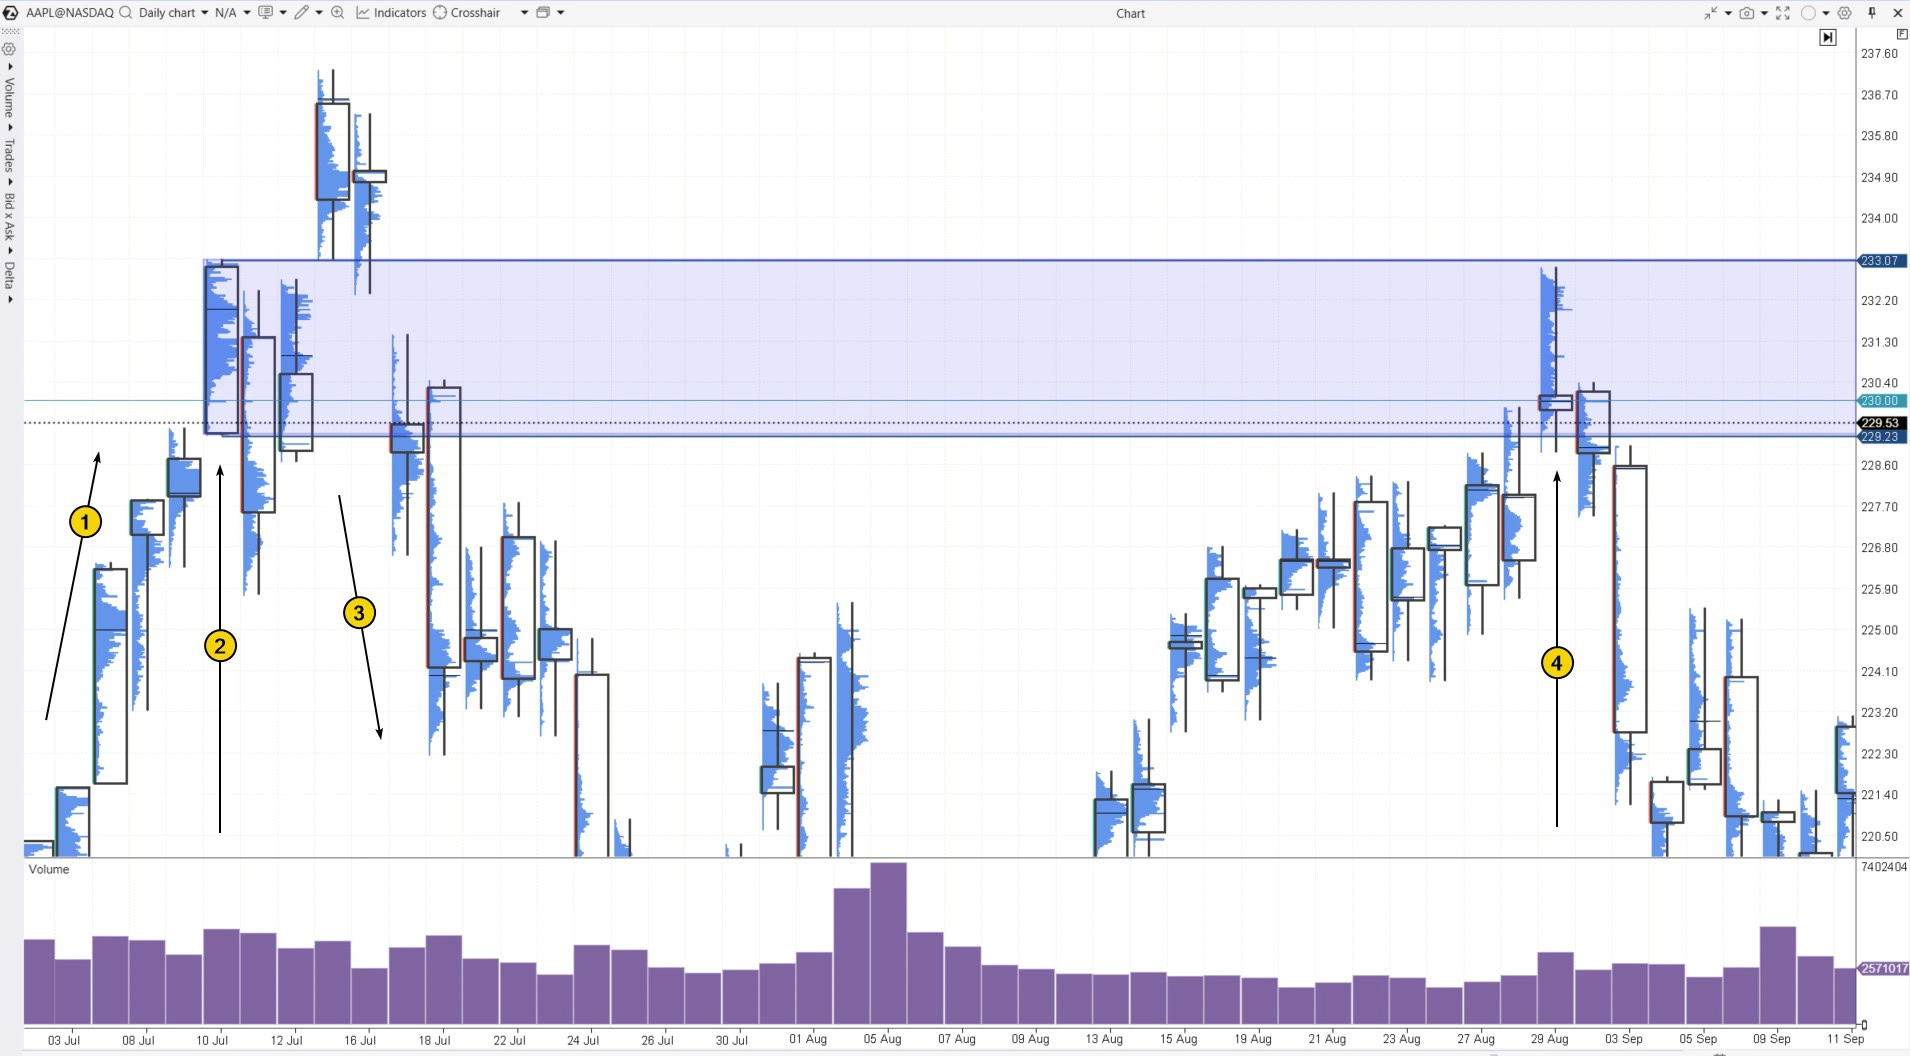
After Apple unveiled Apple Intelligence on June 11, market sentiment turned extremely bullish: AAPL stock broke above the psychological barrier of $200 and continued to rise (1), updating all-time highs until the price reached $230.
Let’s take a closer look at the July 10 candle and its volume profile, and note that the July 11 candle closed well below $230.
This may indicate a temporary impulse in demand on July 10, which faded quickly the next day.
On July 15, the price surged above $235 as Morgan Stanley analysts raised their target price, and Market Watch reported that the stock might reach $300.
Positive headlines fueled buying euphoria, but… who sells at the top when everyone is optimistic? Smart Money.
ICT rules allow marking a Bearish Order Block resistance area to the right after the price drops (3).
The retest of this area on August 29 (4) provided a short entry opportunity. The bearish conviction may have been strengthened by an inverted hammer candle closing below the high-volume node on the profile — a classic sign Smart Money viewed $230 as overpriced for AAPL.
BREAKER BLOCK EXAMPLE
What is a Breaker Block? It’s a situation where an Order Block zone fails to reverse price, and price breaks through it.
According to Smart Money Concept, it happens like this:
-
a Bullish Order Block is formed;
-
during the retest, price does not bounce upward, but drops below it;
-
in this case, the Bullish Order Block becomes a Breaker Block, and it should now be viewed as resistance.
This logic is similar to mirror levels in trading: former support turns into resistance after a breakdown, and vice versa.
Likewise, a Bearish Order Block, once broken to the upside, turns into a Bullish Breaker Block that can later act as support.
An example of a Breaker Block is shown below on the daily chart of QQQ — a financial instrument tracking the Nasdaq index.
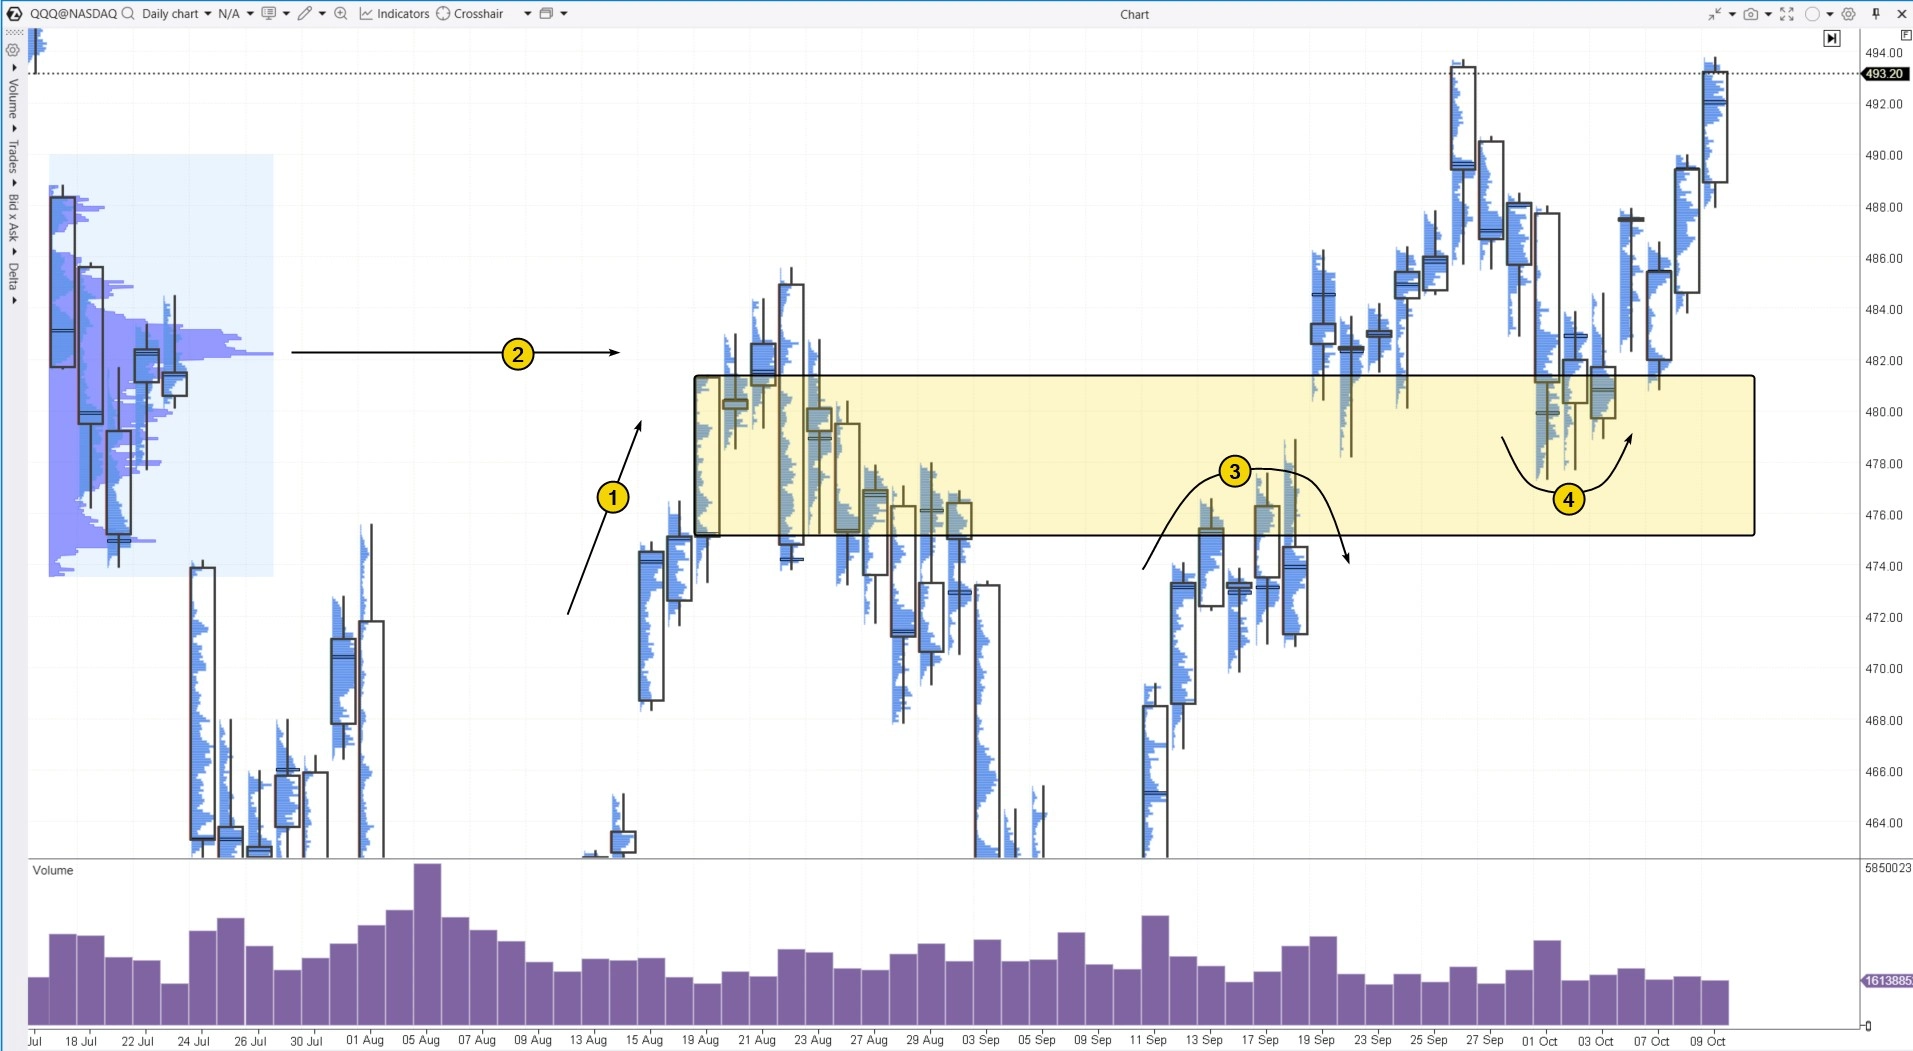
In mid-August (1), price rose toward the resistance level (2), which can be identified using a profile bulge.
On August 20–21, volume was low during the attempted rally (a sign of weak buyers), but on August 22, price fell sharply with increasing volume — a clear sign of selling pressure and sentiment shift.
As price dropped in early September, this served as a basis for forming a Bearish Order Block zone (marked with a yellow rectangle) and anticipating a retest.
In mid-September, the price started to form a bearish reversal (3) from this resistance zone, but the attempt failed, as the September 19 candle opened above it.
This indicated that the yellow zone had become a potential Breaker Block.
All that remained was for candles to fully establish themselves above the zone — which happened on September 25.
According to ICT Smart Money Concept, the former Order Block (now Breaker Block) should be expected to act as support.
And this expectation was validated in October when the price made a bullish reversal (4) upon retesting the Breaker Block area.
FAQ
What does Order Block (OB) mean in trading?
An Order Block in trading is a zone where large players (institutional investors) place significant buy or sell orders, which can stop or reverse the prevailing market trend.
What types of Order Blocks exist in the Smart Money Concept?
-
Bullish Order Block is formed from a bearish candle and anticipates an upward reversal after a retest.
-
Bearish Order Block is formed from a bullish candle and anticipates a downward reversal after a retest.
-
Breaker Block appears when a price fails to reverse from an Order Block during a retest. The zone flips from support to resistance (or vice versa).
What does an Order Block look like in crypto?
In crypto trading, as in forex, a Bullish Order Block is a zone drawn to the right of a bearish candle that closes near its low.
Price is expected to reverse upward afterward (though not always immediately).
The Bearish Order Block follows the opposite principle.
What is the strategy behind Order Block trading?
Order Blocks are used to identify key support/resistance zones and to open trades when the price returns to test those areas.
BT
![]()