WHAT ARE TICK VOLUMES IN FOREX?
⇒ Warning. Any strategy does not guarantee profit on every trade. Strategy is an algorithm of actions. Any algorithm is a systematic work. Success in trading is to adhere to systematic work.
This question typically arises among beginner traders who are getting acquainted with the currency markets using the popular MetaTrader 4 terminal.
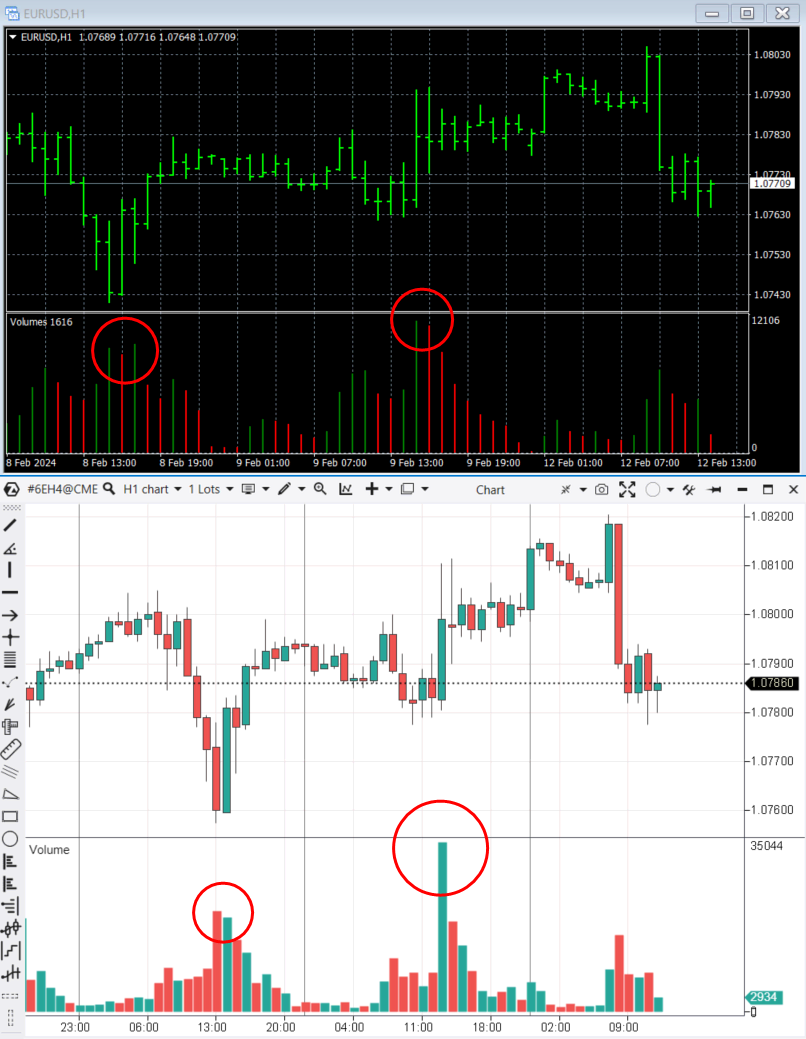
Below is a screenshot of hourly charts from the MetaTrader 4 terminal (EUR/USD market, data provided by the broker) and the ATAS platform (6E futures market, data from the CME exchange).
Forex brokers provide what are known as tick volumes to the platforms they support, including MT4 (top chart). Put simply, they count the number of price changes within a time unit.
Real volumes (bottom chart), on the other hand, represent the number of traded contracts involving real money.
While tick volumes and real volumes are related, they have only a minor similarity. Upon closer examination, the difference between them becomes apparent (marked with circles on the charts).
Cons of tick volume in the standard forex terminal:
- It is not reliable. Tick volumes can vary between different brokers. This is especially true for the forex market which is decentralized by nature. There is no single terminal from which volume data is sourced, leading to potential discrepancies and data manipulation.
- It is not that valuable. Tick volumes do not provide insight into the actual trading volume, measured in terms of shares or futures contracts. It carries less value for analysis and do not accurately indicate the strength/weakness of the market and the current sentiments of traders.
Nevertheless, tick volumes do offer a slight advantage in Forex – they enable traders to make simple judgments about market activity. However, you need actual trading volumes provided by the exchange for more accurate volume analysis.
TICK VOLUME INDICATOR IN THE ATAS PLATFORM
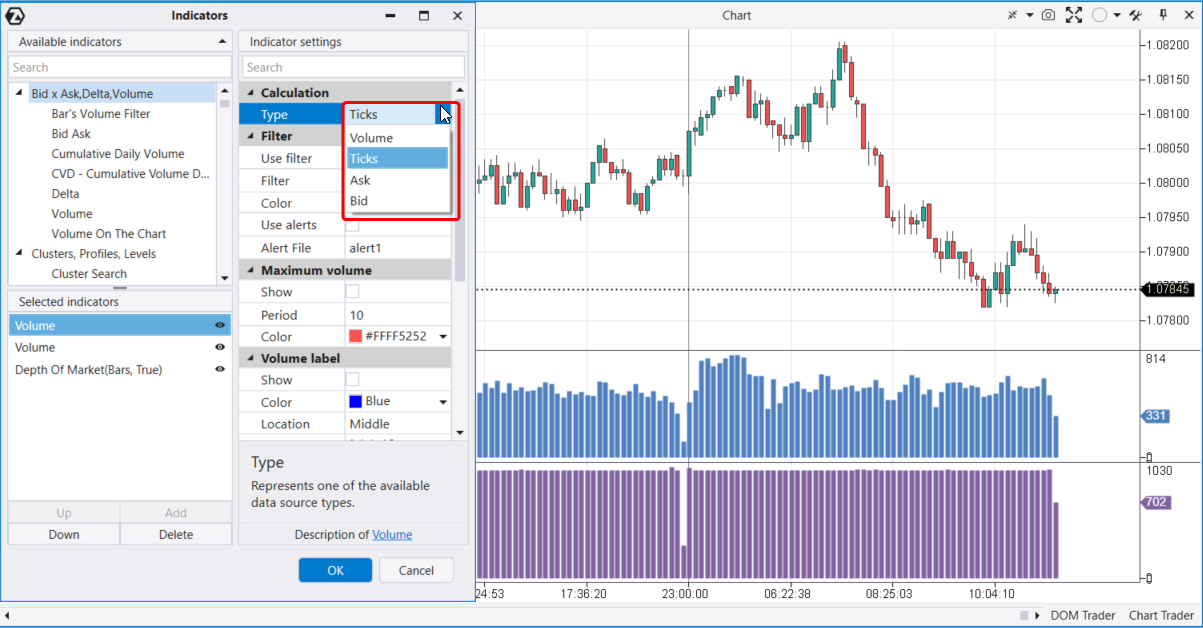
The volume indicator in the ATAS platform has 4 modes:
- Volume – the standard representation of volumes, indicating the number of assets traded (such as futures contracts) per time unit.
- Tick – the number of trades per time unit.
- Ask – the number of assets (contracts) bought, i.e. the volume of market buys.
- Bid – the number of trades executed at the bid price, i.e. the volume of market sells of exchange assets (contracts).
The difference between the first two modes is visible in the screenshot below. This is a Euro futures contract and an independent time chart of the Volume (1000) type, where each new candle opens when 1000 contracts are traded in the market.
Two volume indicators in different modes have been added to the indicator section:
- a purple one, at the bottom – the actual ATAS volume that shows the number of trades in one candle. Here, the volumes look neatly aligned. Their values fluctuate around ≈ 1000, reflecting the core aspect of the Volume chart.
- a blue one, at the top – the ATAS tick volume that shows the number of trades in one candle. Here, the bars fluctuate on the histogram and show varying actual volumes of executed trades.
WHAT IS A TICK CHART?
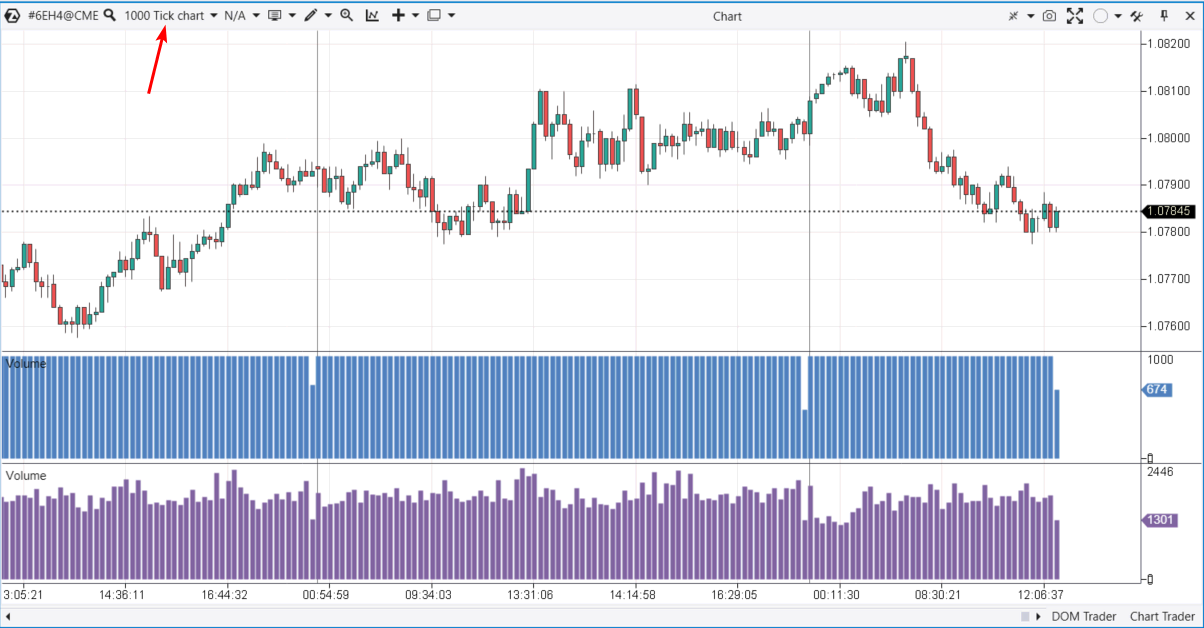
Let’s switch the same chart from the Volume (1000) type to the Tick (1000) type.
As you can see, the situation has changed. Now:
- a purple one, at the bottom – the actual ATAS volume that fluctuates.
- a blue one, at the top – the ATAS tick volume that appears more aligned. Each new candle opens after 1000 trades have been executed in the market.
The main advantage of time-independent charts (Tick Chart and Volume Chart) is that they enable you to view the chart from a different perspective. You can pay less attention to areas with low volatility (such as the Asian session) and focus more on areas with high volatility (such as the American session). Additionally, a tick chart enhances visualization and simplifies the construction of technical analysis chart patterns.
BT
![]()


