WHAT DOES IT MEAN TO CATCH FALLING KNIVES ON THE STOCK EXCHANGE?
⇒ Warning. Any strategy does not guarantee profit on every trade. Strategy is an algorithm of actions. Any algorithm is a systematic work. Success in trading is to adhere to systematic work.
Catching a falling knife means trying to open a long position during a rapid drop in the price.
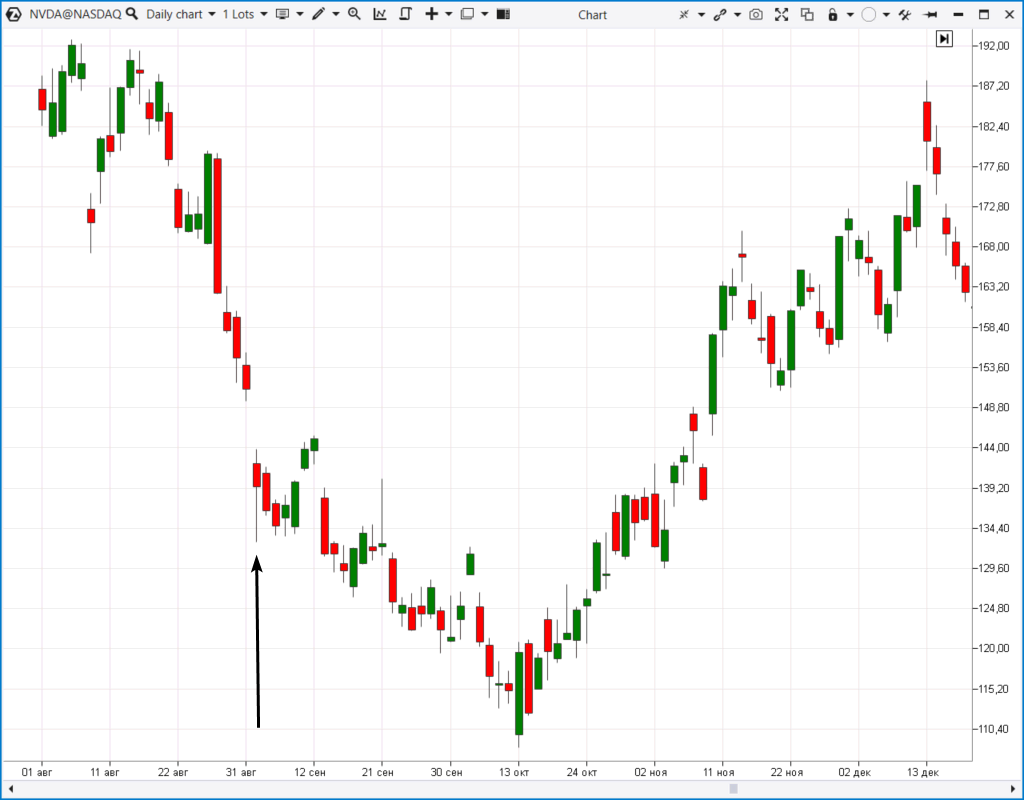
For example, NVDA has an intrinsic value of $180 and you believe that it could go up to $100 in the long term. When the price drops sharply amid bad news with a gap down (shown by the arrow in the chart above), you may decide to buy the stocks, in other words, “catch a falling knife”.
In this example, after a several-month pause, the price rises to the value that you consider fair.
Usually, the phrase “catching falling knives” refers to the stock market when a trader buys stocks after they have fallen sharply and hopes that the price will rebound. The trader believes in the company and that the subsequent price reversal will provide capital growth.
But catching falling knives is not only for long-term investors. The term is also used for short-term trading in futures and cryptocurrencies.
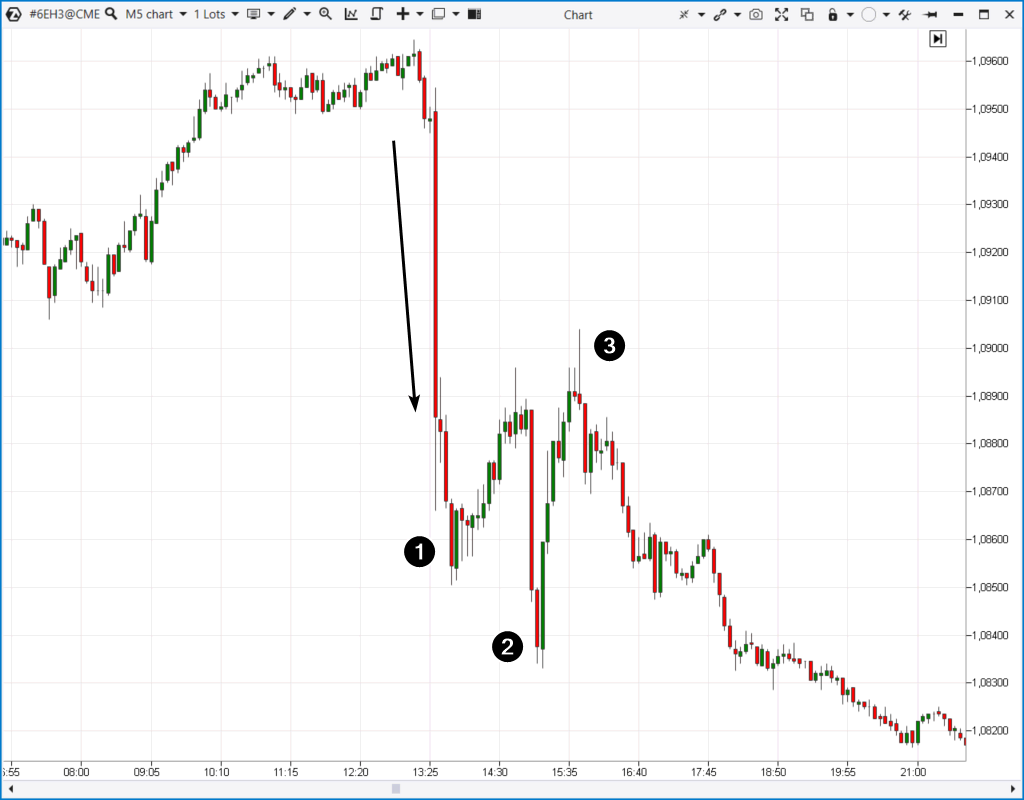
Let’s say the price of the euro is declining rapidly, as shown by the arrow on the intraday futures chart below.
When point (1) is reached, a trader decides to enter a long position.
The position shows an encouraging result for some time, but then falls to a new intraday low (2). Sounds familiar, right?
The trader decides to average their positions by increasing the long ones.
When, fortunately for the trader, the price reaches point (3), the position can be closed completely with a profit. Choosing not to close the position at this point and continuing to hold it may result in significant losses, including irreparable ones.
Does it even make sense to use the “catching falling knives” strategy? Is it possible to reduce the risks? In the following part of the article, we will give you three useful ideas.
We will consider catching falling knives as an attempt to go long on a wide bearish candle. The presented information can also be used in a mirror image — when trying to go short in a rapidly growing market.
DOES CATCHING FALLING KNIVES MAKE ANY SENSE?
Catching falling knives is a great metaphor. It reflects the key features of this trading strategy:
- you can be lucky and open a position at the very extremum. Unfortunately, the chances are low;
- you can see how the price continues to plunge, and you lose an increasingly significant amount of your deposit.
On an emotional level, catching falling knives can feel similar to gambling. The rapidly changing price excites a hot-blood person. A trader who is inclined to push their luck will lean towards opening a position and making a quick profit.
If you are trying to “catch a falling knife” but acting impulsively, the market will punish you sooner or later.
The opposite approach is when your actions are based on a clear plan, valuations, trading knowledge, and accumulated experience. In this case, catching falling knives can be worth it. If the calculation turns out to be correct even after small losses (drawdowns), this can result in a net increase in the total deposit.
The ATAS team is warning you that catching falling knives in trading is a high-risk strategy. We do not recommend it to beginners. Moreover, combining the “catching falling knives” strategy with averaging and not implementing protective stop-losses is unacceptable as it may lead to a complete loss of the trading account.
THREE IDEAS ON HOW TO REDUCE RISKS USING ATAS
Using the advanced instruments for volume analysis available on the ATAS trading and analytical platform, you can significantly reduce the risks of catching falling knives.
You can implement the following ideas:
- apply Market Profile;
- monitor round levels and levels of local extremum points;
- study the readings of professional volume analysis indicators.
Idea 1. Catching falling knives with Market Profile
Market profile is an important instrument for volume analysis. It displays the trading activity at each price level for the selected time period. Using ATAS, you can analyze the sum of volumes, delta, and apply other settings.
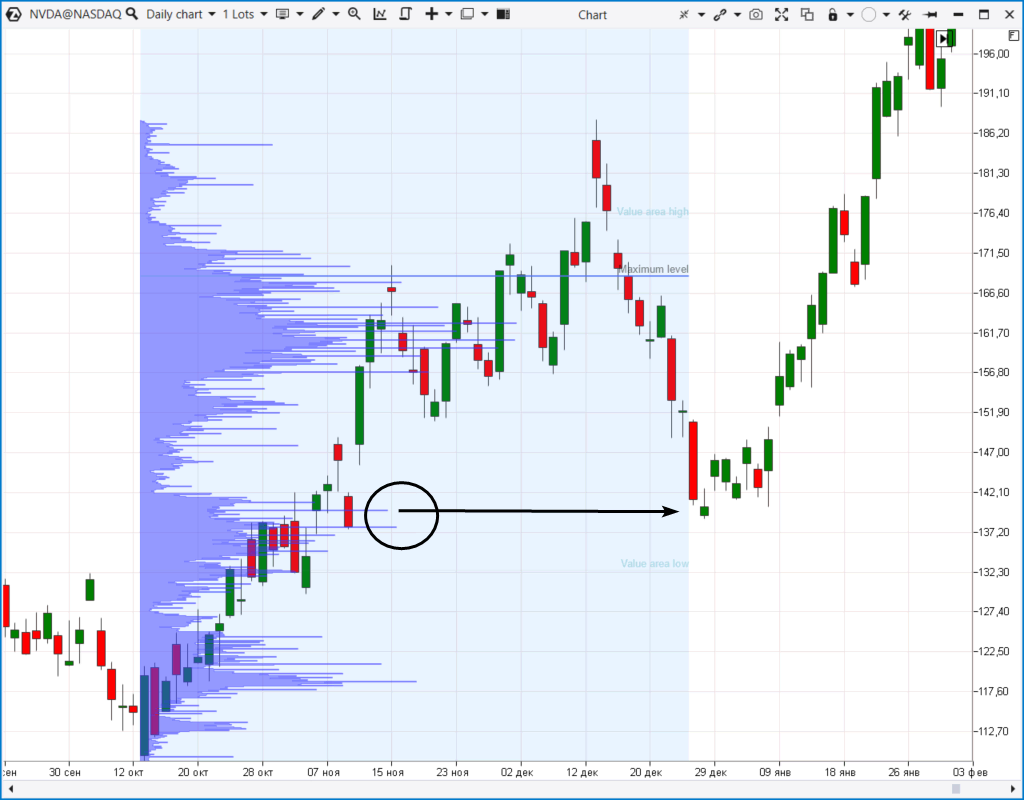
The idea is to find the level of highest trading volume on the profile and use it as a reference point to try to catch a falling knife. It is done in anticipation that high levels of trading activity will impact the price, specifically, a rebound.
Example 1. A daily chart of NVDA stock
After two wide bearish candles, the price fell to the area around $140 per share within three days. Large volumes were recorded there. A reversal occurred in that zone, which led to growth to new highs. Using this approach, it makes sense to place a stop-loss below the zone of high volume levels while maintaining an acceptable risk:reward ratio.
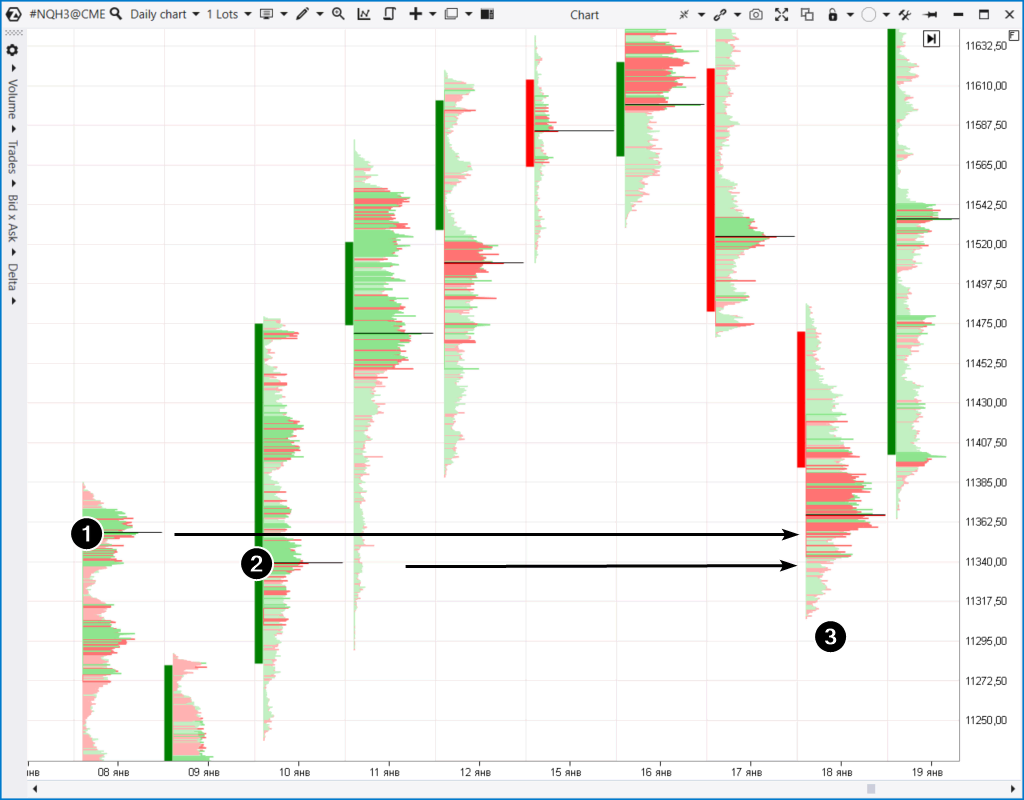
Example 2. Stock index futures
The cluster chart below helps identify a zone of high volume levels that formed on day 1 and 2.
When the price rapidly dropped into this zone (3), it was followed by a reversal and a quite rapid growth.
It is important to note that while the price did not bounce directly from the identified levels, it did dip slightly below levels of high volume. To avoid the uncertainty of whether there will be an undershoot, overshoot or a perfect rebound, it is better to switch to lower time frames, look for confirmation signals there and thereby minimize the risks involved.
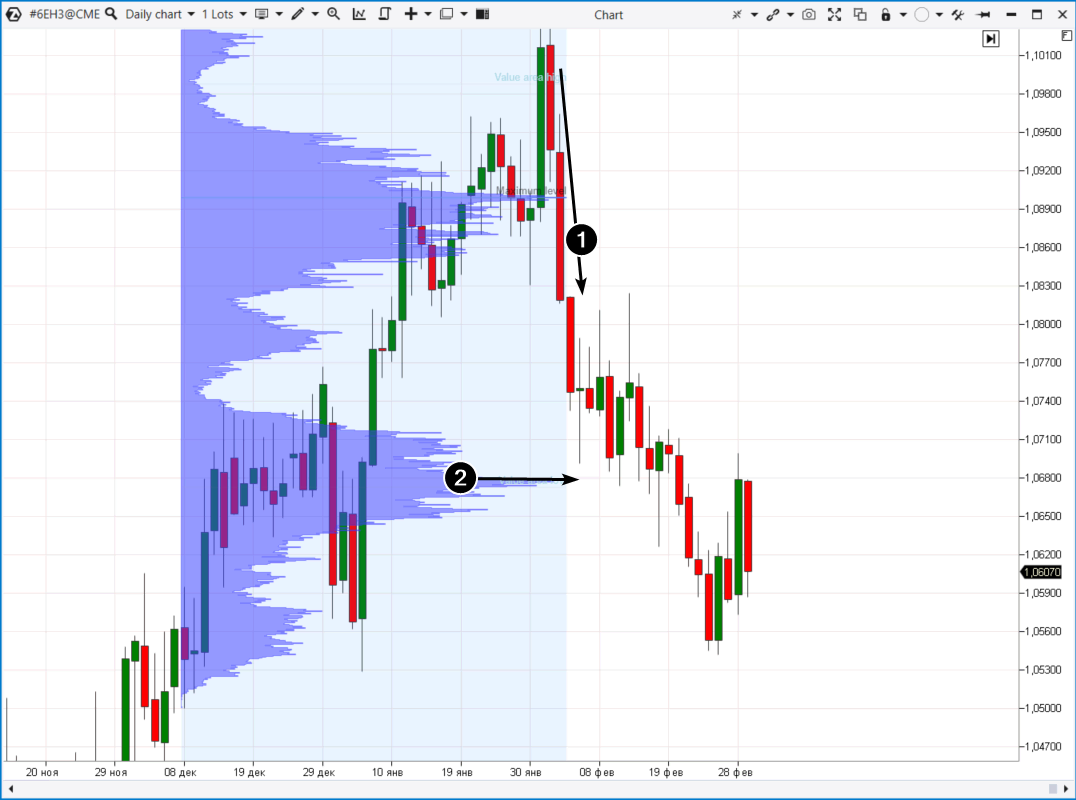
Example 3. Euro futures
After a false breakout of the 1.10 psychological level, the price of the futures plunged down at a rapid pace (1).
Three wide bearish candles formed on a daily chart. On the fourth day, the price fell to a horizontal level of large volumes. There was a rebound from this level, which could bring profit to those who were catching falling knives.
The example above illustrates the situation when the knife continued to fall after a pause. This danger awaits a trader who is opening a position against the trend. When developing a strategy for catching knives, it is essential to consider a scenario in which the fall may continue.
Download the ATAS platform to find and study examples of rebounds from large volume levels on your own.
Idea 2. Catching knives near important levels
The important starting levels are:
- round levels which are indicated by “beautiful” numbers;
- levels built from noticeable extremum points — both intraday and on higher time frames.
Psychology plays a big role in both cases. To learn how to catch knives, you should understand the behavioral motives of other traders.
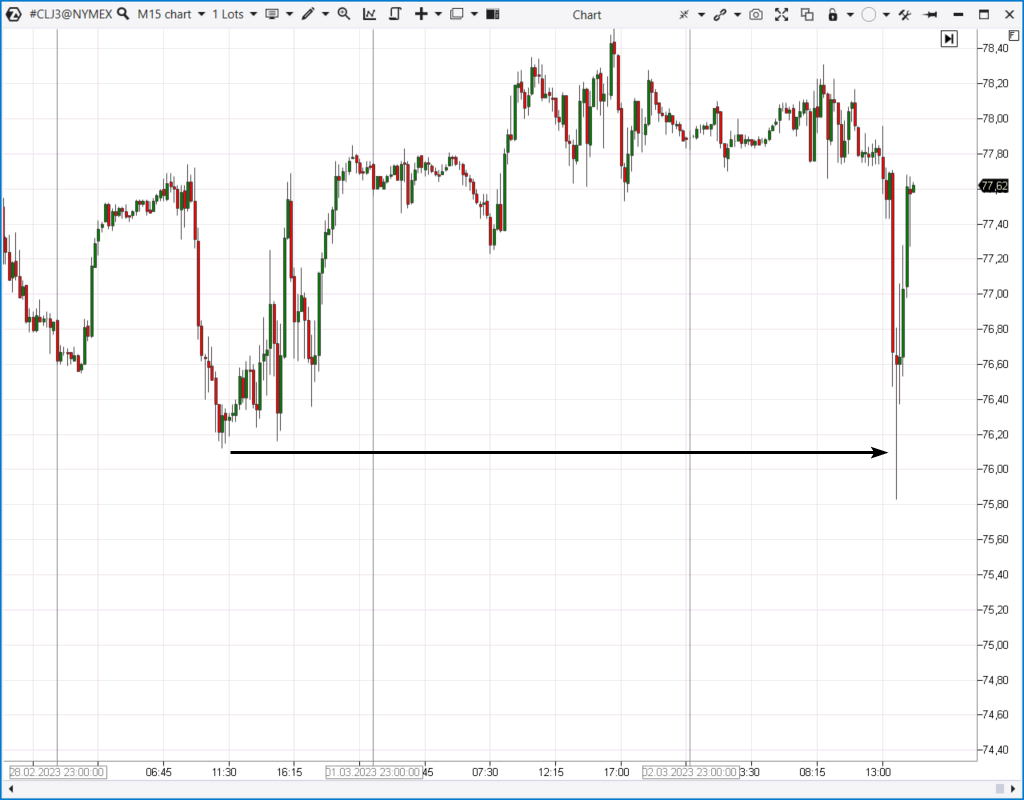
Example 1. A falling knife in the oil futures market, the data was taken from the NYMEX exchange
The chart shows that amid an article in the WSJ about the possibility of the UAE leaving OPEC, a falling knife only slightly “pierced” the local minimum, and then rebounded.
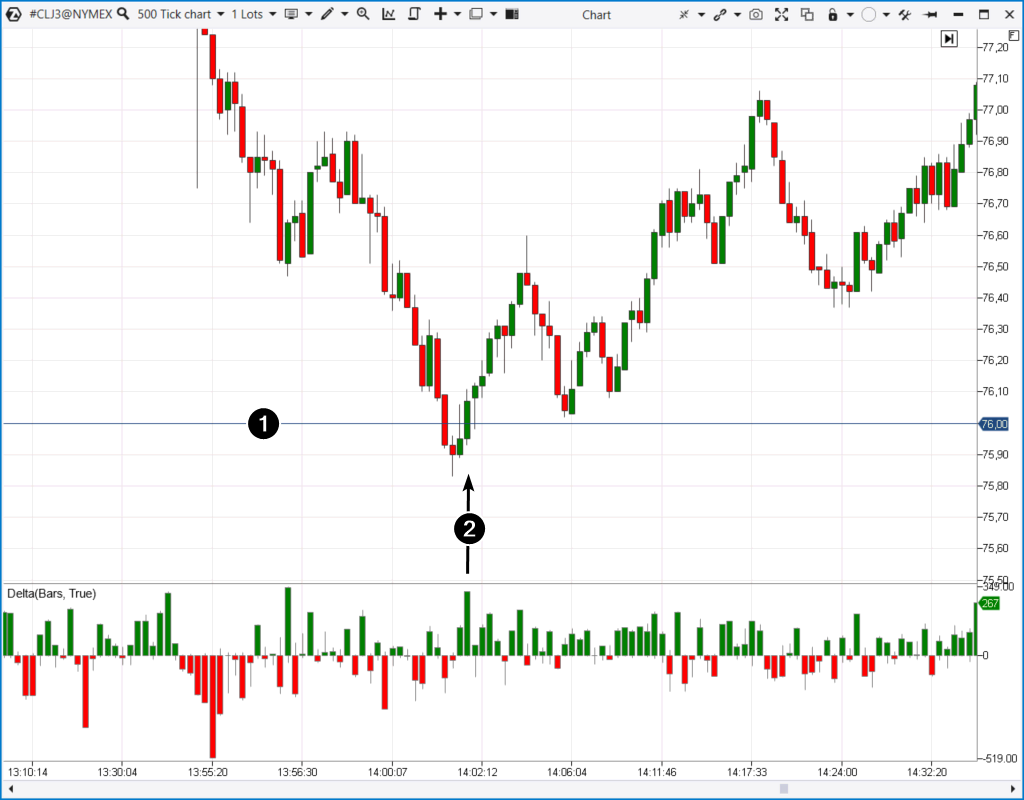
Let’s switch to a lower time frame and have a look at the price action on a tick chart to conduct a more detailed analysis of the market during increased volatility.
Let’s mark a round level (1) on the chart at $76.00 per contract. Pay attention to the delta behavior. Once the price:
- dropped below the local extremum (marked on the chart above);
- dropped below the round level;
…there was a spike in positive delta (2). Looking back, we can see that it was a great signal to enter a long position and an example of a masterfully caught knife.
Why did the price turn up? Perhaps there was a cluster of buyers’ stop-losses below two important levels. Why does the price reverse after it crashes into such clusters? This is a topic for a separate article, if not an entire book.
Example 2. XBT futures from the BitMEX exchange
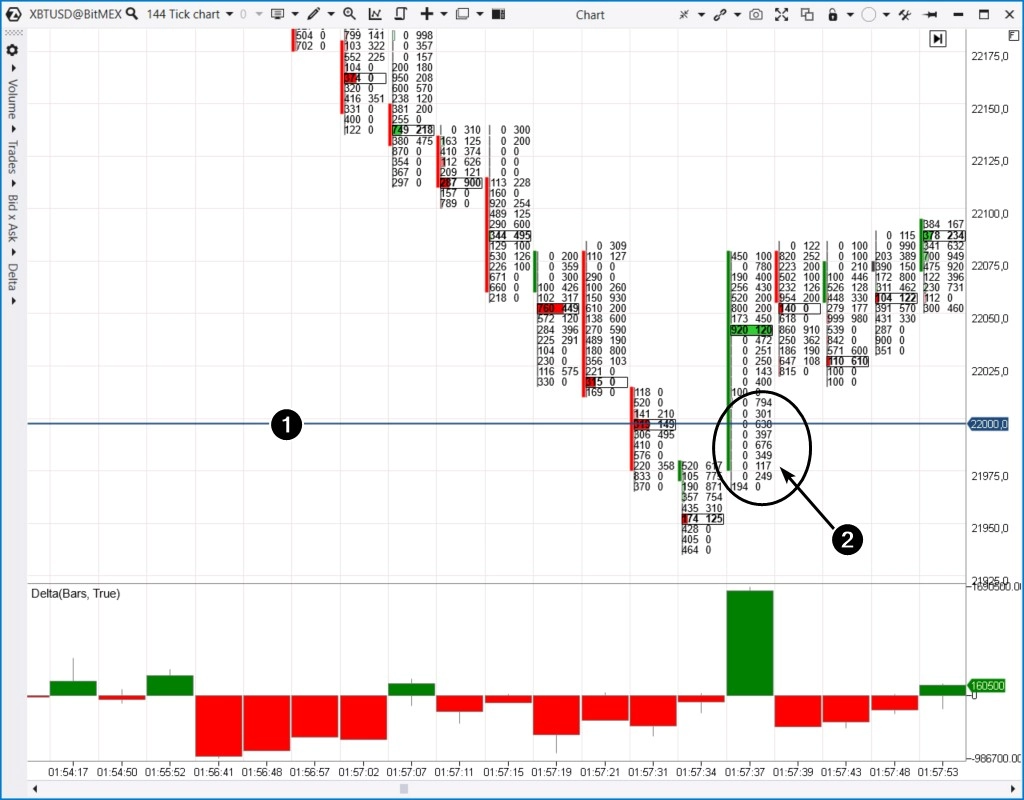
The cluster chart below illustrates the decline in the price of Bitcoin amid the news about the Silvergate crypto bank’s problems. In one hour, the price collapsed by 5%. But when did the rebound happen? And what did the clusters show?
The reference point for the rebound was the psychological level of $22,000 per coin. The chart confirmed that the supply was exhausted, but the demand increased. This can be seen not only by the spike in positive delta that happened right after the psychological level was pierced, but also by Bid x Ask. Zeros show the complete absence of sellers (supply vacuum) amid buyers’ activity — a situation when the price rises sharply.
Example 3. Gold futures
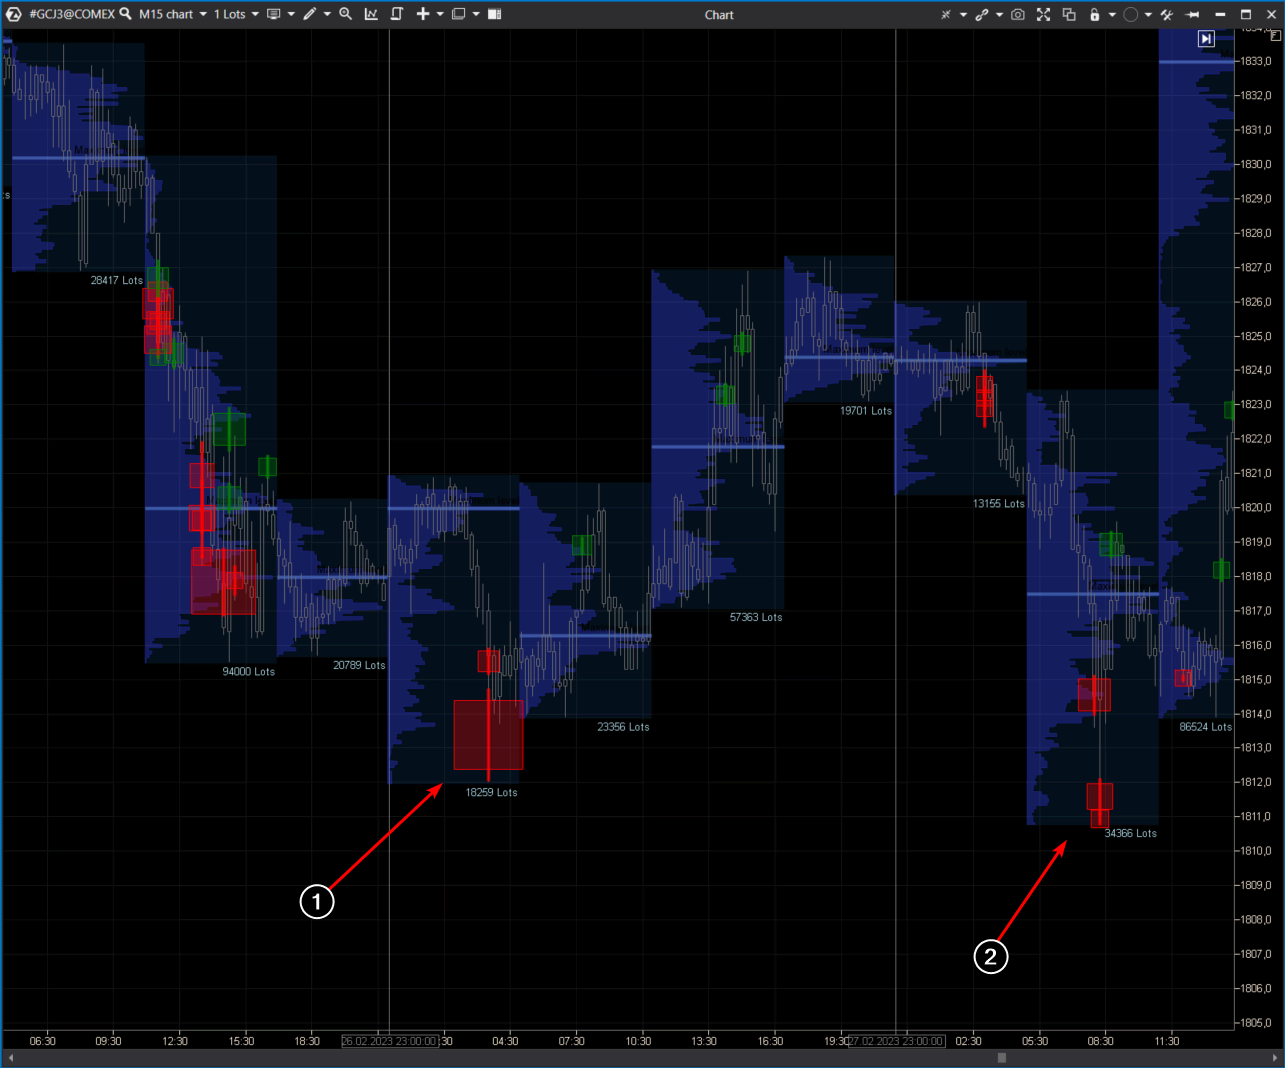
This chart shows two falling knives marked with 1 and 2. They looked especially dangerous intraday on the 1-minute or 5-minute time frame.
Specifically for dark theme lovers.
In both cases:
- the price quickly dropped below the previous day’s low;
- the Big Trades indicator signal appeared on the chart, indicating large sales. After that, the price skyrocketed. Surprising? “No,” professional traders will say.
Using professional indicator signals to analyze volume is another great idea to minimize the risk of trying to catch a falling knife.
Idea 3. Catching falling knives with professional indicators
In addition to the Big Trades readings on the chart above, you can experiment with the following indicators from the ATAS platform:
- Speed of Tape shows the speed at which trades are taking place. The indicator can be configured separately for buys and sells;
- Stacked Imbalance is usually triggered during important reversals;
- DOM Levels shows support and resistance levels by analyzing the volume of limit orders placed in the DOM.
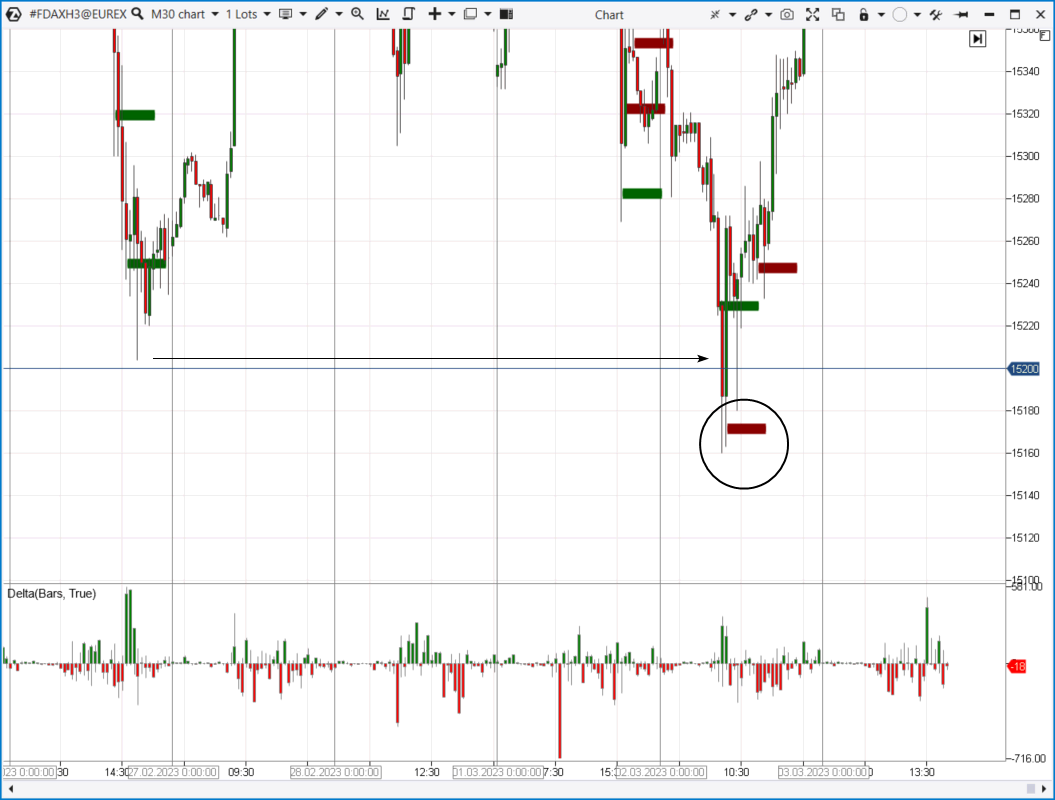
Example 1. DAX index futures
The price quickly dropped below the local minimum and the psychological mark. Then the Stacked Imbalance indicator was triggered. This could be a valid reason to try to catch a falling knife.
When you download ATAS and learn how to use its indicators for your own purposes, you will find more reasons to catch knives on lower time frames.
BT
![]()
