WHAT EXHAUSTION OF BUYING OR SELLING PRESSURE IS
⇒ Warning. Any strategy does not guarantee profit on every trade. Strategy is an algorithm of actions. Any algorithm is a systematic work. Success in trading is to adhere to systematic work.
Traders can use different descriptions, but the idea remains the same. Exhaustion means a gradual decrease in the activity of buyers or sellers as the price becomes less and less favorable for them.
When current prices become unfavorable for market participants, they naturally show less initiative. This is how the classical law of supply and demand manifests itself.
In the following part of the article, we will show a few examples, but we must warn you that they will not be perfect references. In real trading, there will always be noise and other factors that distort the signal but a professional trader must recognize it on a chart in order to achieve their goal.
EXAMPLES ON CHARTS
To identify exhaustion in the market, one should use the volume indicator and / or its derivatives (for example, delta).
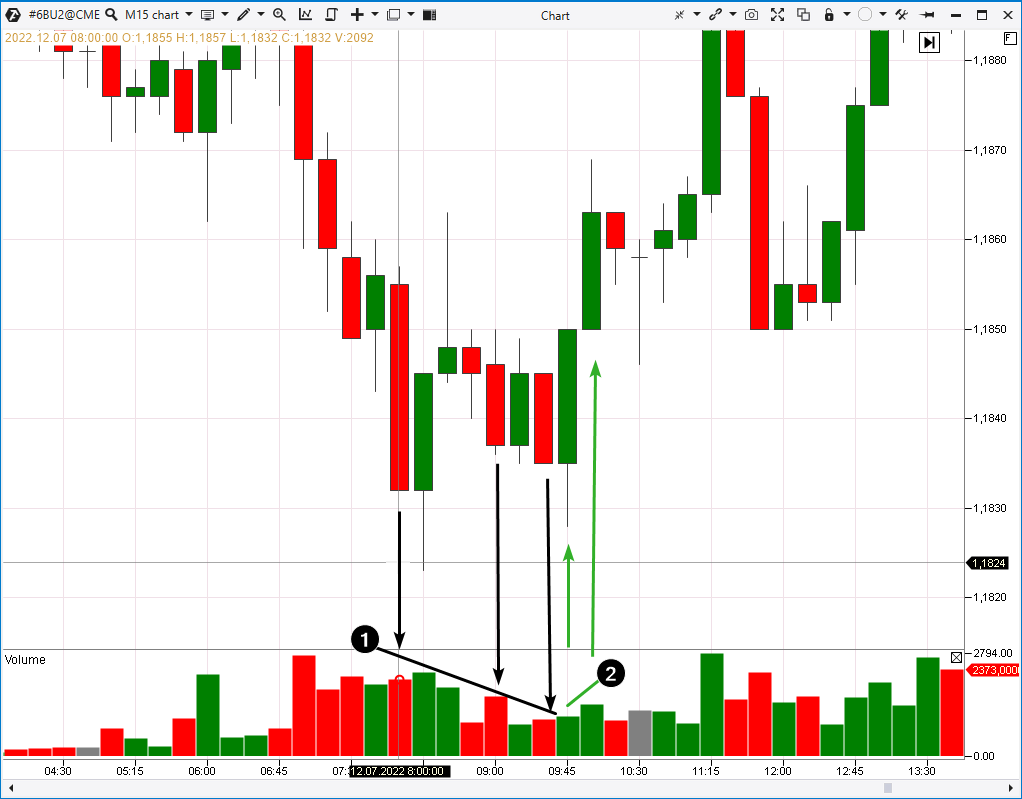
The first example is from the futures market for the British pound, the time frame is 15 minutes. A simple volume indicator has been added to the chart.
A gradual decline in volume (1) on bearish candles indicates the exhaustion of sellers’ pressure. Fewer traders are willing to sell contracts when the rate falls into the 1.1830-1.1840 zone.
A following increase in volumes on bullish candles (2) confirms that the sells have exhausted.
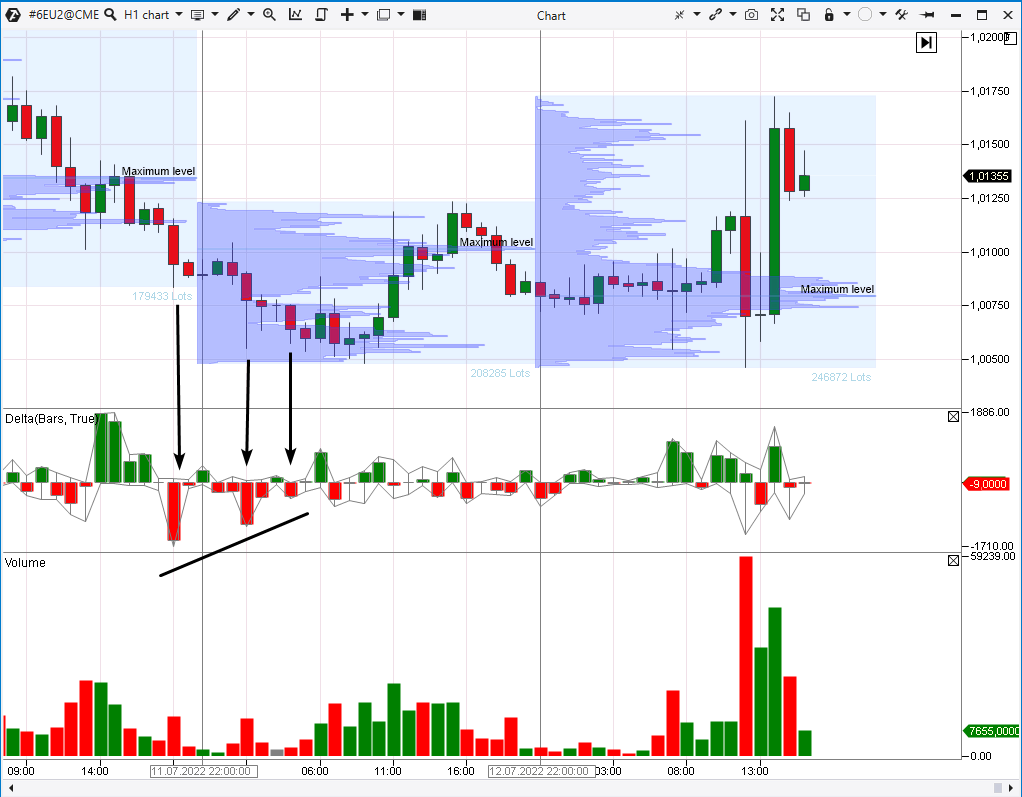
The second example is selling exhaustion on the euro futures chart (hourly time frame) during a decline to the 1.000 psychological level. We have added not only the volume indicator, but also delta (what is delta in trading) and daily profiles.
The arrows show that the sellers demonstrated less and less initiative as the euro exchange rate fell to parity with the dollar. Further events showed that investors started to expect an increase in the base interest rate of the ECB (which at that time had been equal to 0% for more than 6 years).
The third example demonstrates that the exhaustion signal can also be read:
- on non-standard chart types,
- during spikes in volatility.
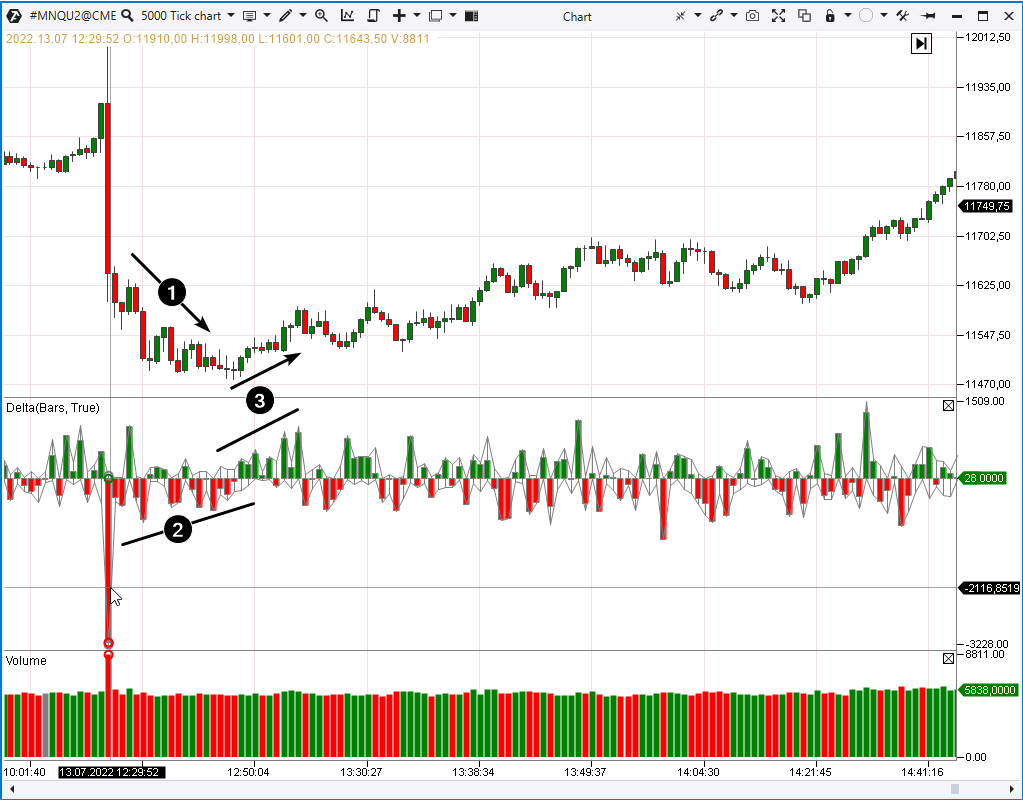
This is what selling exhaustion looks like on a tick chart (NASDAQ stock index futures) with the Delta indicator. The chart displays the course of trading when the Federal Reserve released important news.
The price goes down (1) after the news, but the delta is less and less negative (2).
The subsequent rise in prices and activation of buyers (3) confirmed the change in market sentiments. Apparently, the first reaction to the news was wrong. When emotions became less intense, more and more sellers came to the conclusion that selling contracts was getting unprofitable.
In addition. The examples on the charts above show signals of selling pressure exhaustion as prices decline. The same is true for the opposite signals of buying pressure exhaustion as the price increases and buyers no longer want to overpay for an asset.
HOW TO TRADE EXHAUSTION SIGNALS?
Use ATAS indicators to improve your trading efficiency.
Also, pay more attention to signals of selling exhaustion:
- when the price drops to the support level,
- within a stable uptrend on the long-term time frame,
- amid strong bullish patterns.
The opposite is true for signals of buying exhaustion.
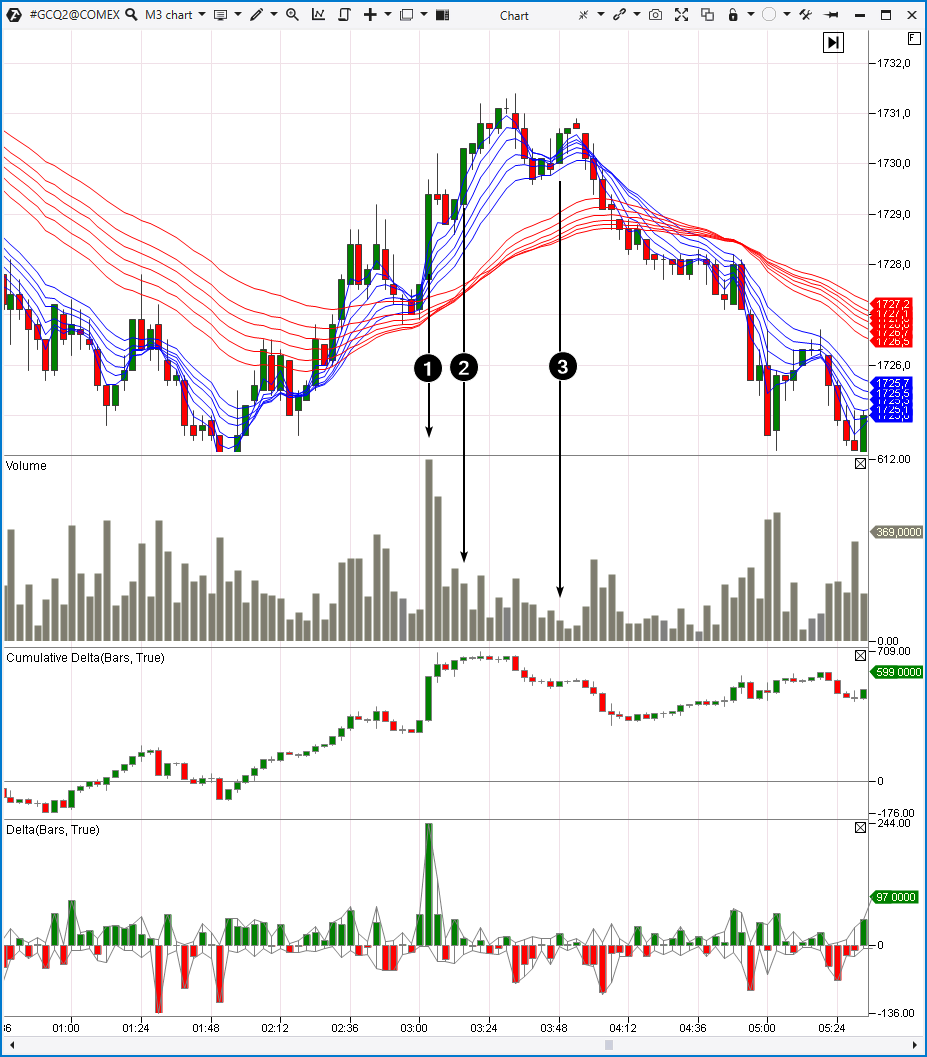
The example below shows a situation in the gold futures market.
The Guppy indicator (a set of moving averages) is added to show that there has been a significant bearish move in the background, so a rise in prices could lead to the exhaustion of buyers’ pressure.
That is exactly what happened. As the price was rising to the 1730 level (which served as support the previous day), the strength of the bullish momentum was getting more exhausted.
Arrows 1, 2 and 3 show bullish candles, but the volume on these candles gradually disappears. Thus, the ATAS platform indicates a shortage of traders who are ready to buy. It can be concluded that a price reduction is coming.
By the way, the bullish impulse marked with the number 3 forms the right shoulder of the head and shoulders pattern. Buying exhaustion can often be read in the formation of this pattern, thus the volume indicators confirm its authenticity.
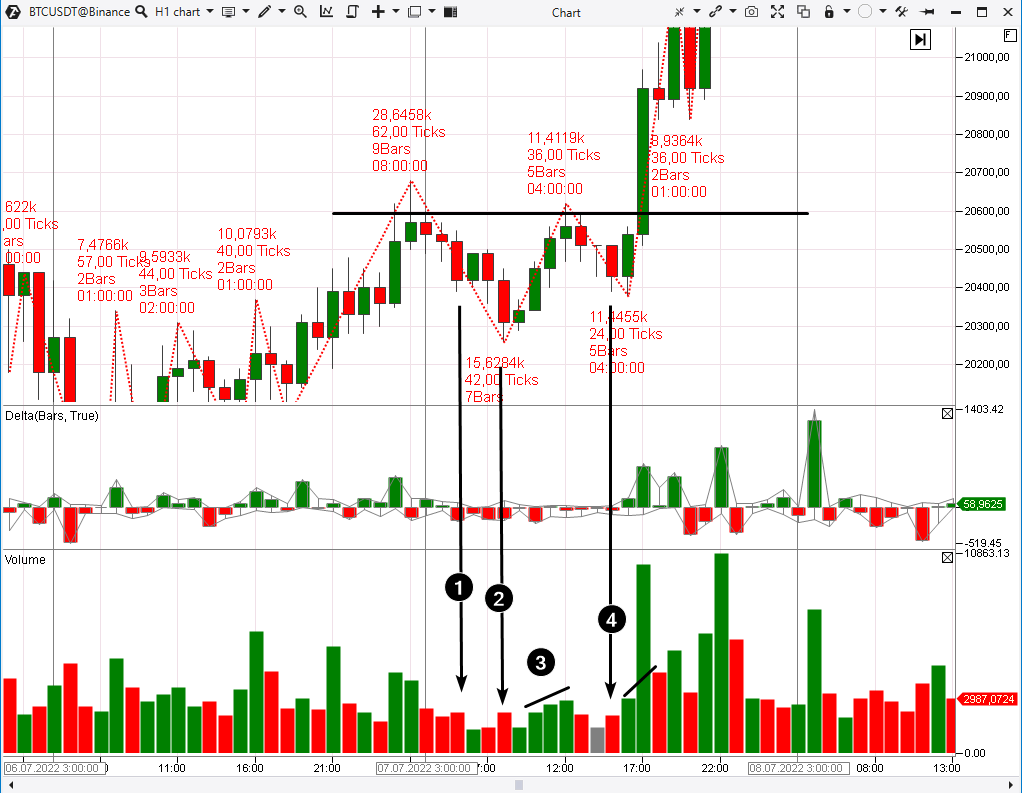
The following example shows how selling exhaustion led to a breakout of resistance.
This is a cryptocurrency market, the data was taken from the Binance exchange. The ZigZag Pro indicator has been added to the chart. This indicator breaks a sequence of candles into alternating waves of rising and falling prices.
Arrows 1, 2 and 3 point to the exhaustion of selling pressure (a similar pattern is read with the ZigZag Pro). Fewer and fewer traders were ready to part with bitcoins, this was a harbinger of a bullish breakout.
Download the ATAS program for free right now – watch for signals of exhaustion near important resistance/support levels. Volume indicators and the logic described above will help you form your own opinion about whether the level will hold or break.
How to start trading signals of exhaustion on the stock exchange
Volume exhaustion signals are a consequence of the natural law of supply and demand, which is applicable not only on the stock exchange, but also on any market.
If you see buying exhaustion near an important support level, it offers the possibility to open a long position.
Use the ATAS platform indicators to get an advantage in reading market sentiments from the price chart and volume confirmation of a bounce.
Practice opening long/short positions when enterprising buyers/sellers enter the market after a selling/buying exhaustion signal.
BT
![]()
