Pin bar pattern in trading. Pin bar trading strategies
There are two types of pin bars:
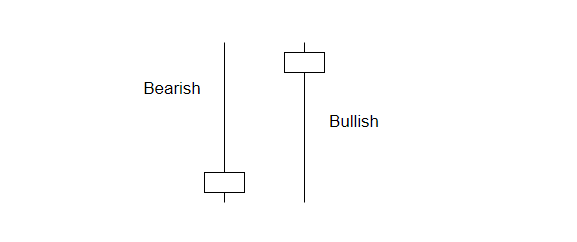
- a bearish pin bar, it has a long upper tail;
- a bullish pin bar, it has a long lower tail.
You can see examples of pin bars in the following diagram, the bearish pin bar is on the left and the bullish pin bar is on the right.
There are no strict criteria for proportions, bar directions and other characteristics. Therefore, identifying a pin bar on a chart is a rather subjective process.
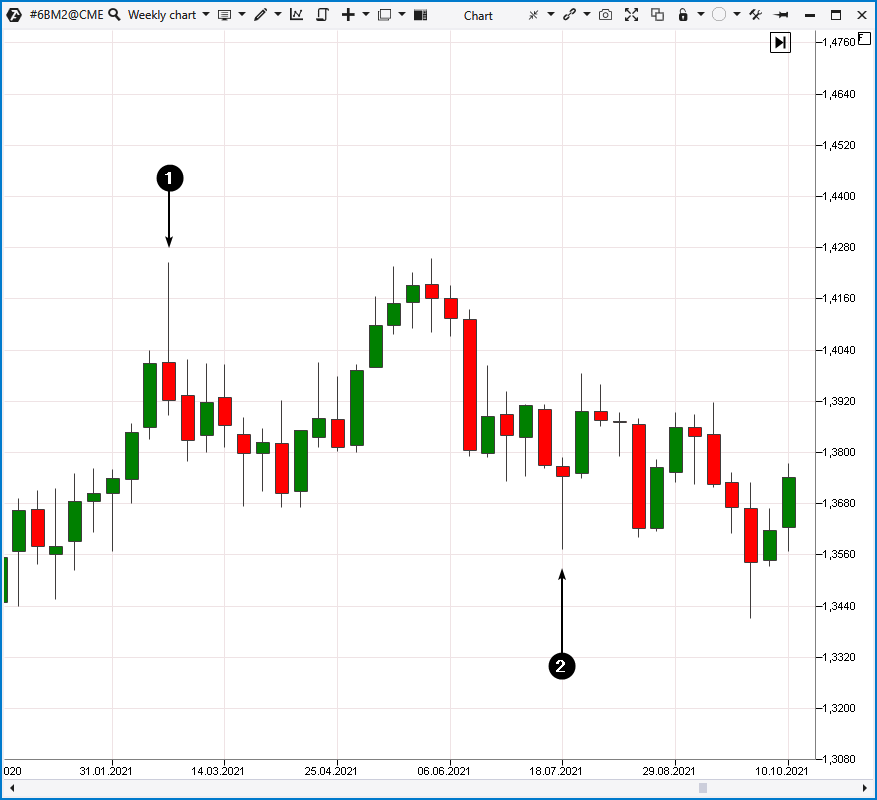
Here is what pin bars look like on a real stock chart (the weekly British pound futures market is used):
Number 1 indicates the bearish pin bar, number 2 indicates the bullish pin bar.
Using the terms of candlestick patterns, two candlesticks of a bullish engulfing pattern form one bullish pin bar, while two candles of a bearish engulfing pattern form one bearish pin bar.
HOW TO INTERPRET PIN BARS
A pin bar is usually interpreted just like a reversal pattern.
A bearish pin bar means that the progress made by the buyers was almost completely stopped by the pressure of the buyers that appeared in the market. The “bears” considered that the price became too high after a period of growth and they lowered it with their activity. As a result, a long upper tail was formed.
The opposite is true for a bullish pin bar.
SIMPLE PIN BAR TRADING STRATEGY
According to pin bar strategies, one should enter a short position straight after a bearish pin bar appears and enter a long position straight after a bullish pin bar appears. However, is this strategy worth using on a real account?
It would be too easy to make money in this case. Experiments with the rules of placing stop-losses and take-profits are unlikely to help.
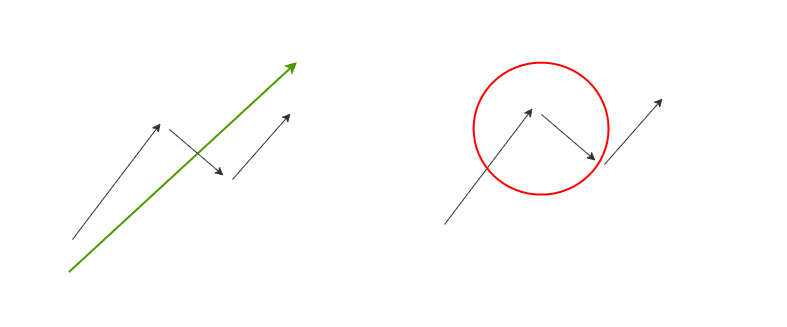
In the picture below you can see a schematic diagram of one of the reasons why simple pin bar trading strategies can cause losses.
On the left you can see the structure of a bullish trend when short-term pullbacks can occur after upward impulses within the main price increase (marked with a green arrow).
On the right you can see that the final part of the impulse and the following pullback (circled in red) can form a pin bar. A trader who sees this pin bar and decides to go short will immediately find a growing negative position.
HOW TO IMPROVE THE EFFICIENCY OF PIN BAR TRADING
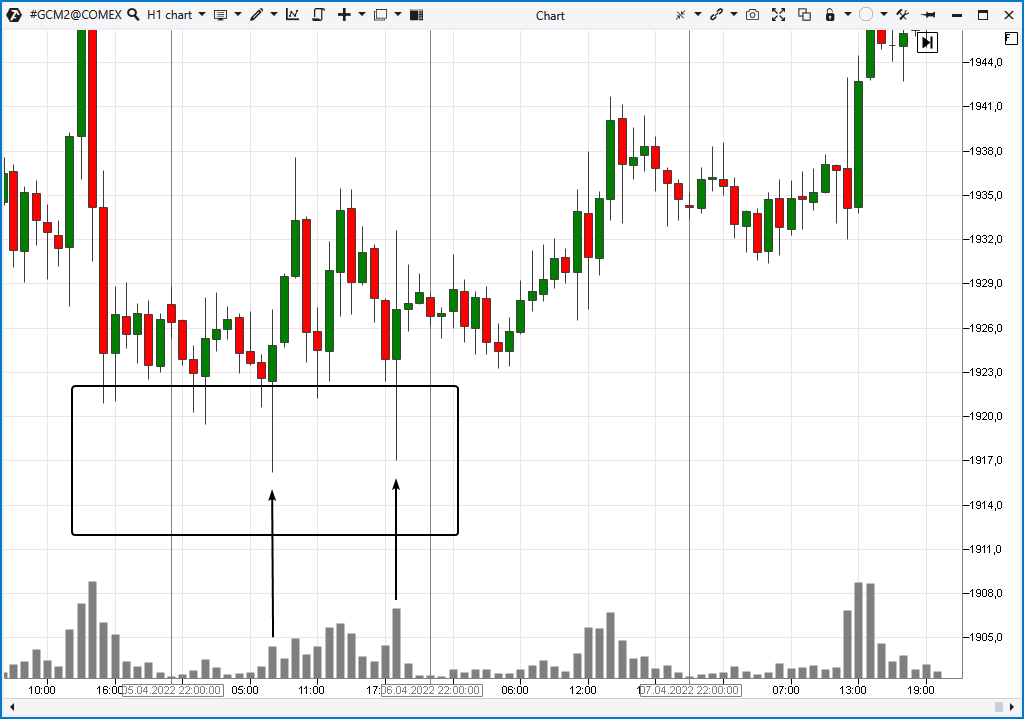
A simple way to improve your trading with pin bars is to look for pin bar clusters.
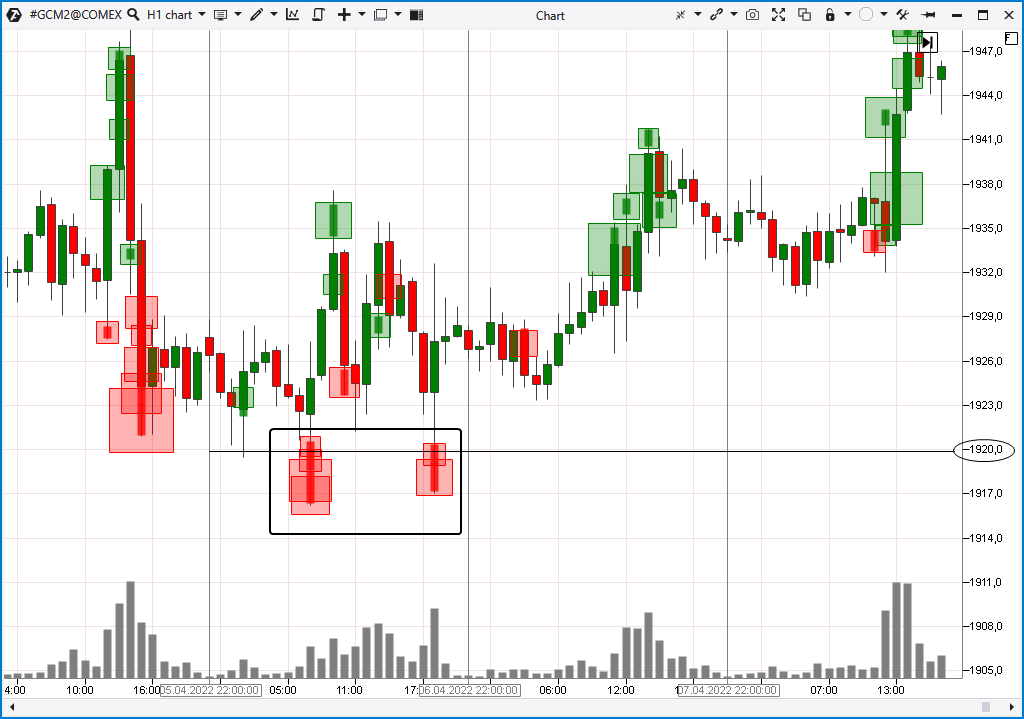
For example, the chart above (the hourly gold futures chart) shows a series of candlesticks with long lower shadows, which suggests there is demand for gold around $1920 an ounce.
Another way to increase activity is to pay attention to splashes of volume. It is believed that they add significance to pin bars.
It is also recommended that you pay attention to the overall context of the market. This advice is always useful. When you spot a pin bar on a chart, do a comprehensive analysis. Is there evidence of a change in market sentiments? Is a pin bar a coincidence?
To improve the efficiency of pin bar trading (and other classic strategies), use the advanced volume analysis tools provided by the ATAS platform. You can download the platform for free.
HOW TO CONFIRM A PIN BAR USING VOLUME ANALYSIS
Let’s use the example of the same hourly gold futures chart. The difference is that the Big Trades indicator has been added to the chart.
Look at the cluster of red signals of the Big Trades indicator. They are on the lower shadows of the pin bars. Presumably these large market sells indicate that long positions of those who placed their protective stop-losses under the 1920 round level are being liquidated.
Having seen these indications of the Big Trades, one could more confidently (and more timely) enter long positions as the price began to rise.
Clusters of large volumes on pin bars’ tails can be a good way to increase the efficiency of trading. This will be shown further below, but for now let’s look how the Market Profile indicator can be applied.
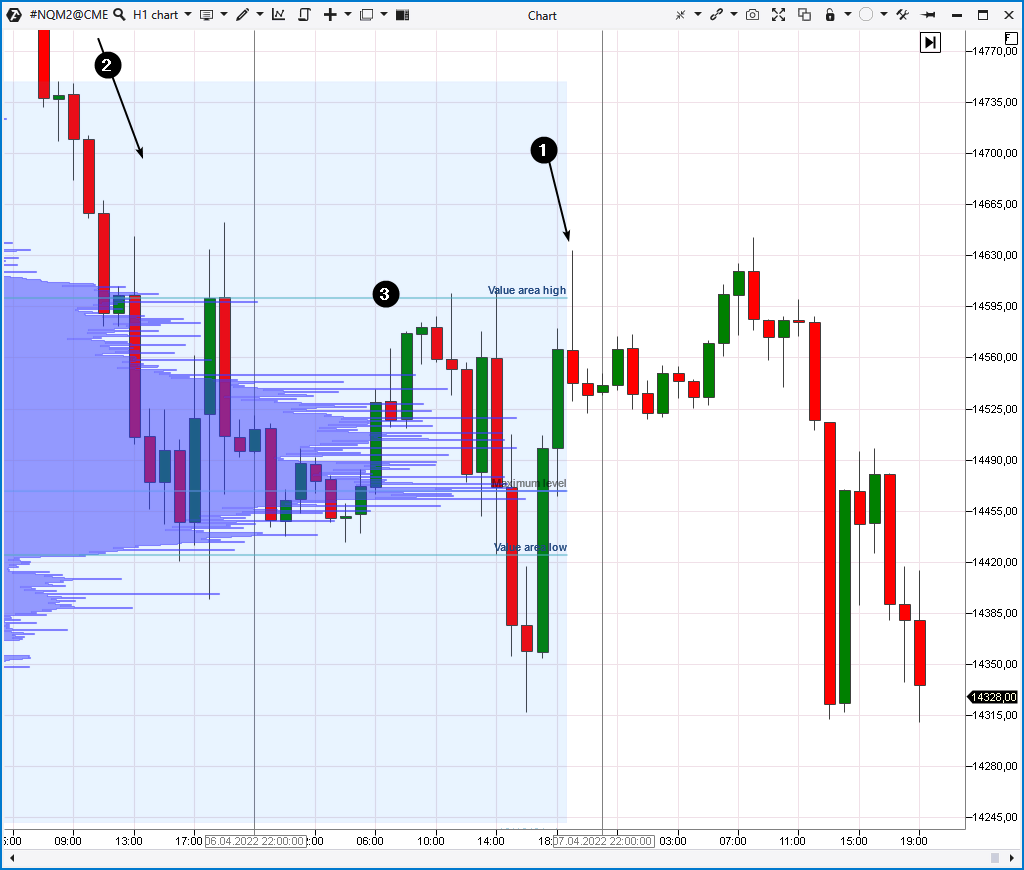
For example, let’s suppose that a trader has found a pin bar (1) on an hourly Nasdaq futures chart:
Number 2 indicates a recent downward movement. It implies that bearish sentiments prevail in the market. Therefore, bearish pin bars have priority.
Number 3 indicates the VAH level, i.e. the upper limit of the value area where the balance was reached after the decrease. The pin bar appeared just around the VAH level, and this is the logical place for it to appear. Everything looks like 14600 and above is too expensive for a contract.
The pin bar implies that sellers near VAH (approximately above 14600) are actively selling with the expectation that the asset is overvalued and / or the price will decrease in the future (which happened the next day).
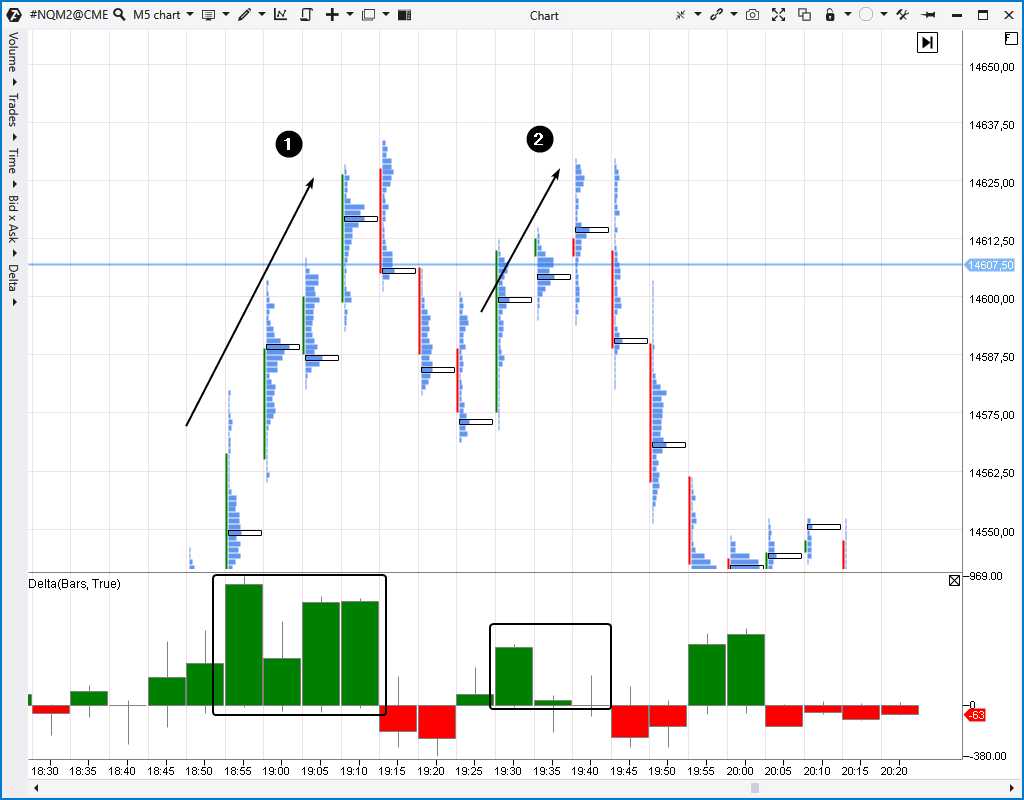
Let’s have a look at how this pin bar from the hourly chart looked in a 5-minute footprint (what is a footprint).
A double top pattern stands out on a faster time frame.
A typical thing for a double top was that the volumes of buys were much higher on the first wave. Analysis of the volumes on the second wave (marked with a rectangle) indicates that “buyers are exhausted”. The appearance of a red delta at 19:45 could serve as a signal to sell (or justify looking for sales within the next day).
PIN BAR INDICATOR
There are many useful tools among the professional indicators of the ATAS platform, but there is no specific indicator that marks pin bars on the chart (at least at the time of writing this article).
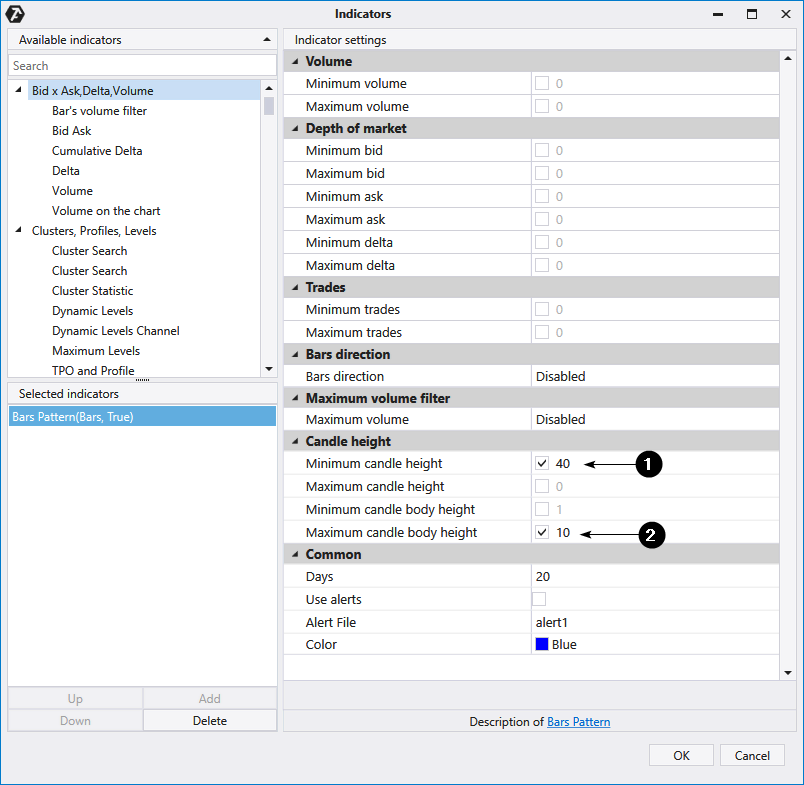
However, there is the Bar Patterns indicator. It can be customized to mark pin bars.
Add the Bar Patterns indicator to the chart and customize it as shown below:
- Set the minimum candle height.
- Set the maximum candle body height. The value should be several times less than the minimum candle height. The value should be selected individually based on the chosen market and the desired sensitivity of the indicator.
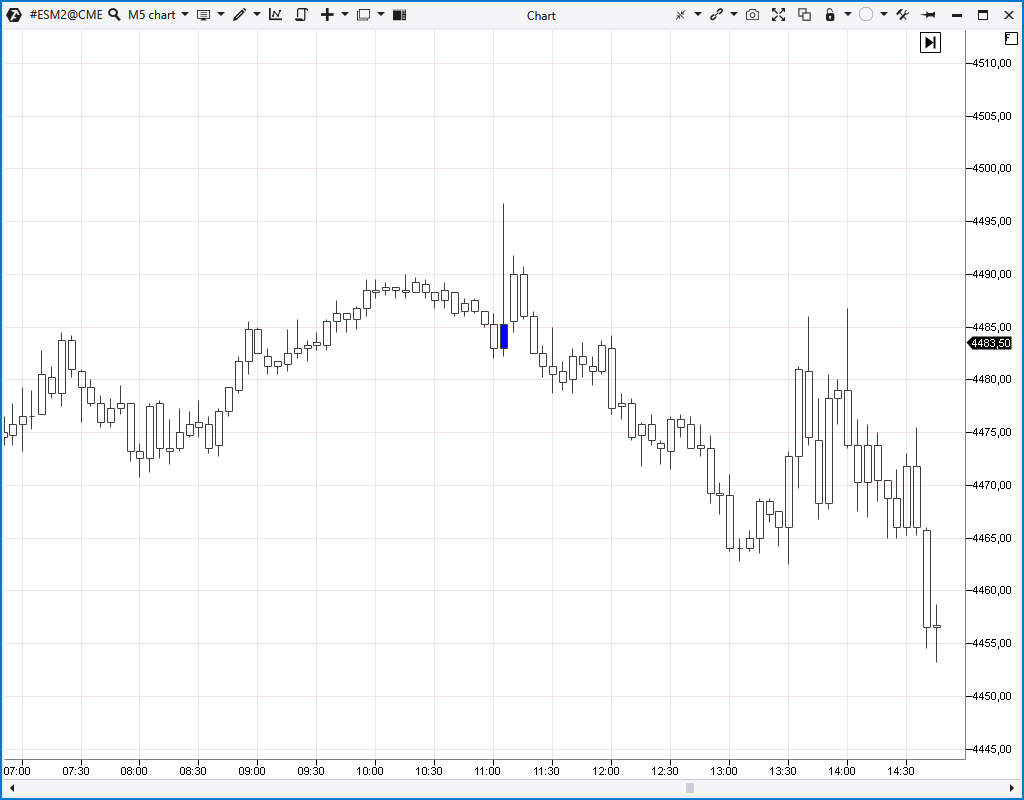
On the chart below you can see that the Bar Patterns indicator has been used to find pin bars and the following results have been obtained:
The found pin bar is highlighted in blue.
There are several advantages of a pin bar indicator created with the help of the Bar Patterns indicator:
- you can set up alerts;
- there is a volume filter;
- there is a bid, ask, delta filter;
- there is a bar direction filter;
- there is a “number of trades” filter.
PIN BARS ON DIFFERENT TYPES OF CHARTS
Usually, talking about pin bars, people mean the charts of standard time frames, for example, 5-minute, hourly, daily charts.
Thanks to the capabilities of the ATAS platform, you can also look for pin bars on charts of non-standard periods, for example, 45-second, 12-minute, 3-hour…
It is also possible to experiment with finding pin bars on rare types of charts, such as Renko, various types of Range, Reversal, Delta and others.
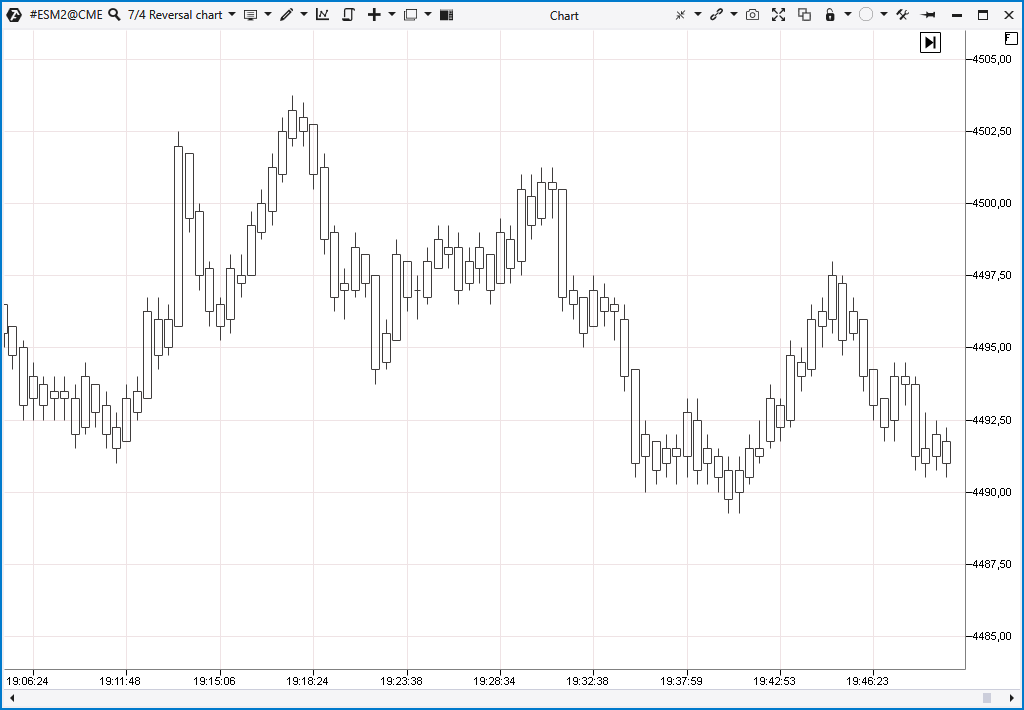
However, these experiments may not lead to the desired results. For example, on the Reversal charts (screenshot ↓ below) all tails are approximately equal in size. It is impossible to find pin bars among them.
Read how to use non-standard types of ATAS charts in this article.
PIN BARS AND DELTA INDICATOR
Towards the end of the article we will show a few practical examples.
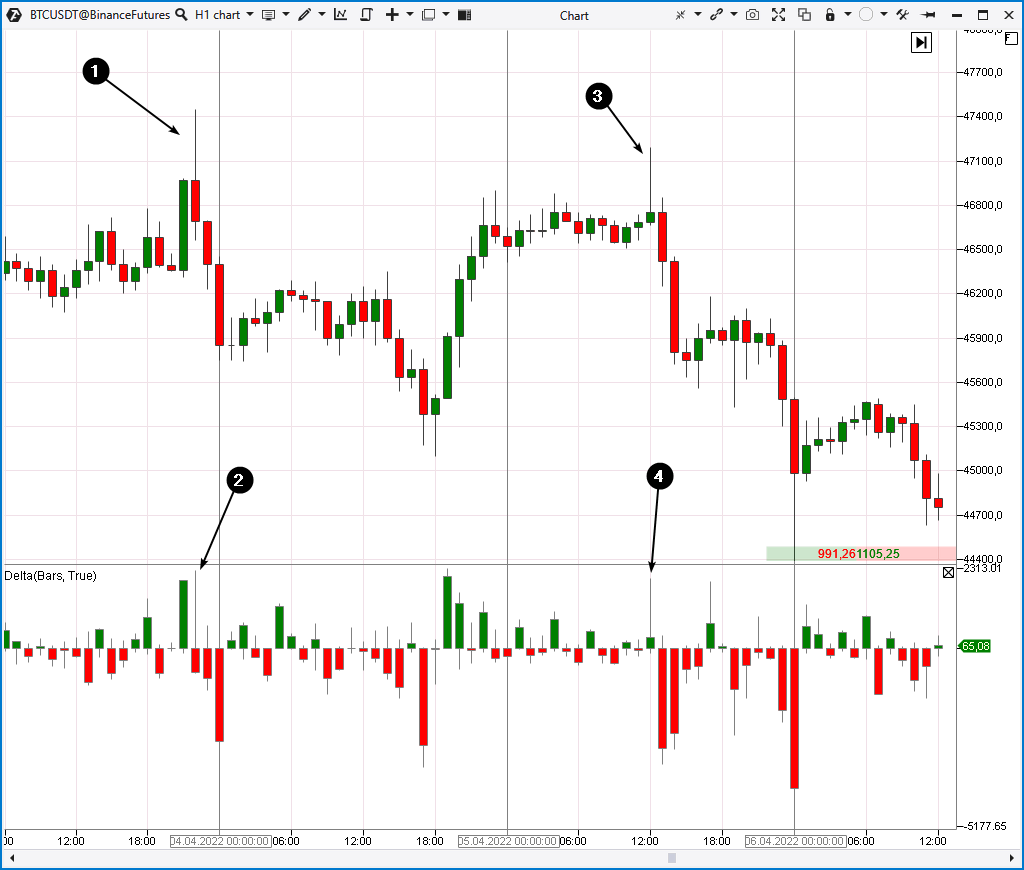
The first one is from the bitcoin market, hourly time frame.
The chart shows how the delta indicator can confirm pin bars.
Numbers indicate:
- A bearish pin bar on the price chart
- A bearish pin bar on the Delta indicator
- Another bearish pin bar on the price chart
- Another bearish pin bar on the Delta indicator
In this case, two pin bars confirmed by delta indicate that sellers are active above the 47k level. Therefore, selling as close as possible to this resistance will make sense.
PIN BARS AND CLUSTER SEARCH INDICATOR
We have already mentioned that large volumes on the shadows can carry important information for reading market sentiment and price forecasting. This example will show you how to use the Cluster Search to find large clusters on pin bar shadows.
The Cluster Search “looks inside” candles and marks on the chart those candles that meet the specified criteria. To search for large volume on the shadows of candles, you need to set:
- volume values that you are concerned with in the Calculation section;
- the Price Location filter to Upper Wick (if you are looking for large volume on the upper shadow) or Lower Wick (if you are looking for large volume on the lower shadow).
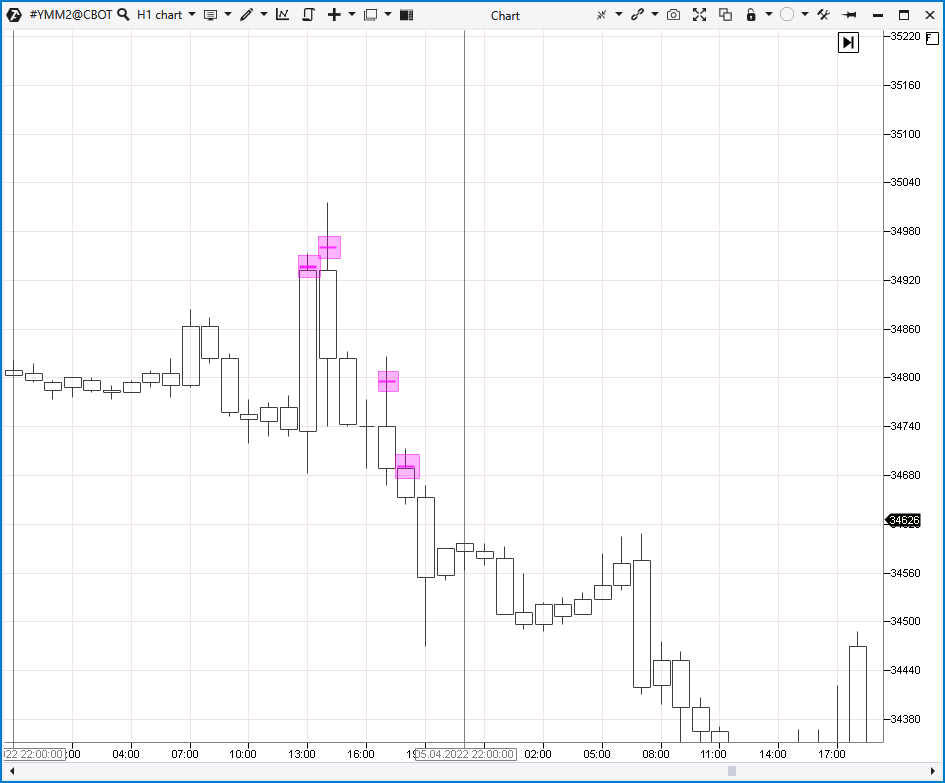
The Cluster Search indicator has been added to the Dow Jones index futures chart and the following results have been obtained:
The indicator found four cases of large volume appearing on the upper shadows. The pink elements show exactly where the large volumes were.
Perhaps only the third candle can be called a pin bar. However, this example demonstrates what really matters.
A pin bar may not have a perfect shape, but the large volume on the shadow of the candle is what gives pin bars their important content.
![]()
