TREND DIAGRAM
⇒ Warning. Any strategy does not guarantee profit on every trade. Strategy is an algorithm of actions. Any algorithm is a systematic work. Success in trading is to adhere to systematic work.
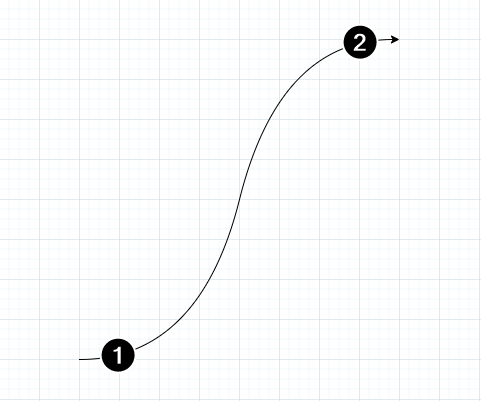
Below is a diagram of a bullish trend (the opposite is true for a bearish one).
The arrow above shows the price increase, the numbers indicate:
- Trend emergence period – when professional participants enter long positions: large hedge funds, experienced investors. They make decisions based on the findings of analyst teams, complex mathematical models, insider information and other information that is inaccessible to most traders due to its value.
- Trend culmination period – when a lot of retail traders enter a long position. During this period, the uptrend becomes too obvious – it can be seen in the price rise, optimistic comments from the “gurus”, and media headlines. It is usually too late to go long at this stage.
In both cases, you can see prints of large buys on the chart.
However, in the first case, it indicates the activity of a big player, which may serve as a rationale for your own purchases that align with their intentions.
In the second case, you may follow the herd instinct or succumb to the FOMO effect, which is the fear of missing out on potential profits. Either way, trading is risky.
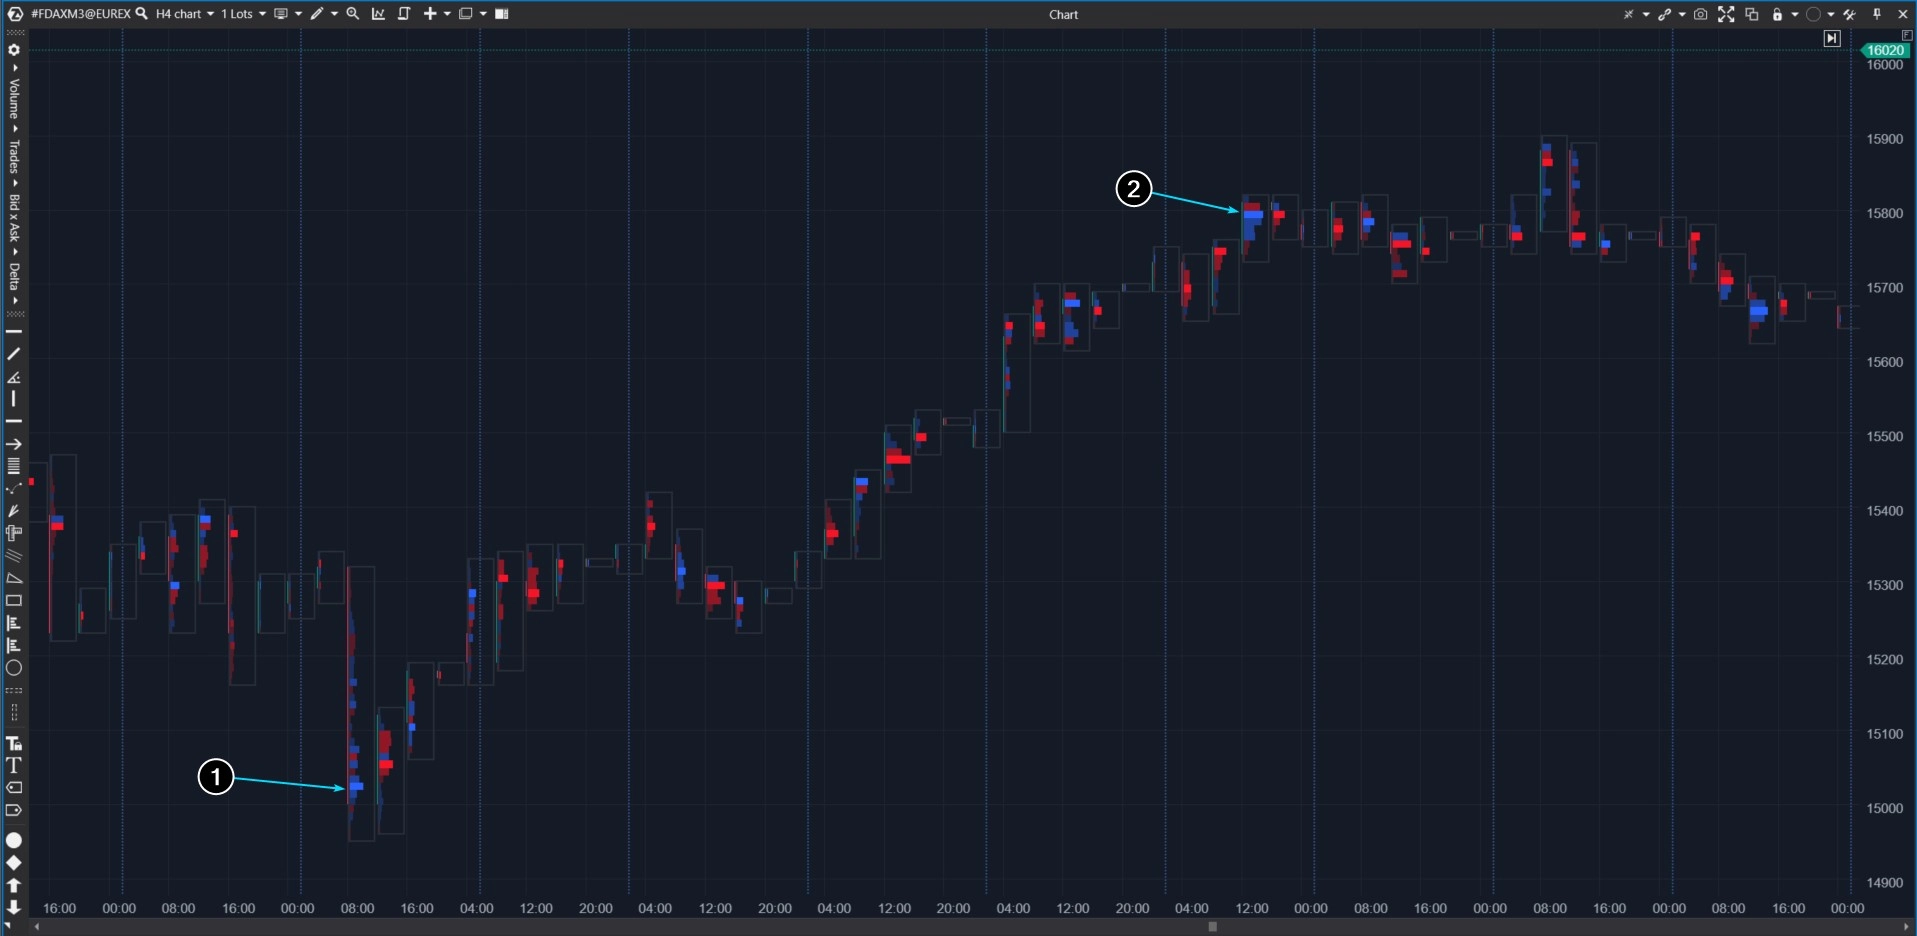
The following chart will help you better understand what we are talking about. This is a footprint from the futures market for the DAX stock index.
Numbers indicate:
- Buys that were probably made by a major player after the release of important economic news. Perhaps the first reaction to the news was wrong and led to local panic, and the professional decided to take advantage of the low prices.
- Demand from a lot of retail traders after a price increase and positive media coverage. As one might suspect, it is being met by a large player who is closing his long position at a profit.
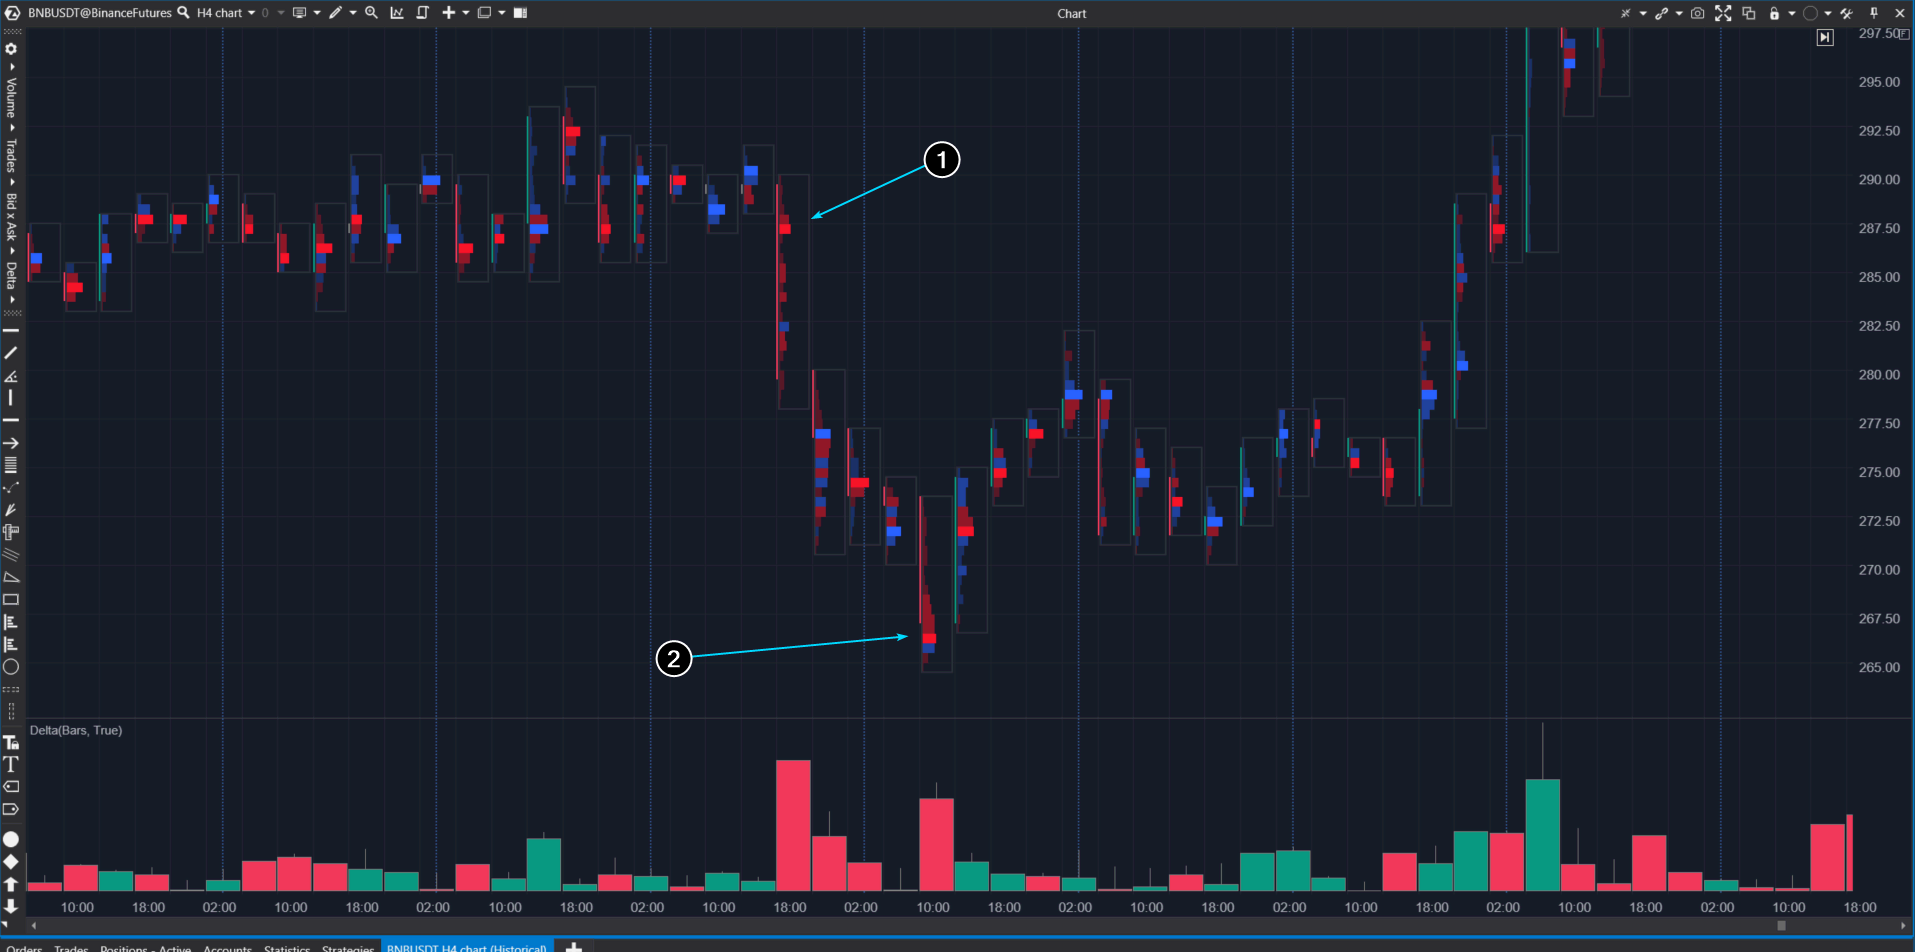
And this is how the sales of large players (1) and the mass of retail traders (2) look in the context of a downward movement (an example from the Binance Futures exchange):
In trading, you constantly face different dilemmas:
- the price can go up or down;
- the price can move on high and low volumes;
- volumes can represent buys and sells;
- buying and selling can represent totally different motives for professional traders and the mass of retail traders.
The solution to the problem of duality in volume analysis is not to focus specifically on single prints but to form your own judgment based on the larger picture.
When analyzing large volumes, consider the context of their appearance. As Tom Williams, creator of the VSA, said: “It can be either a polar bear in the Arctic or a polar bear in Africa.”
The examples below will give a better understanding of how to analyze high volumes in the general context of the market.
VOLUME ANALYSIS EXAMPLES
Example 1
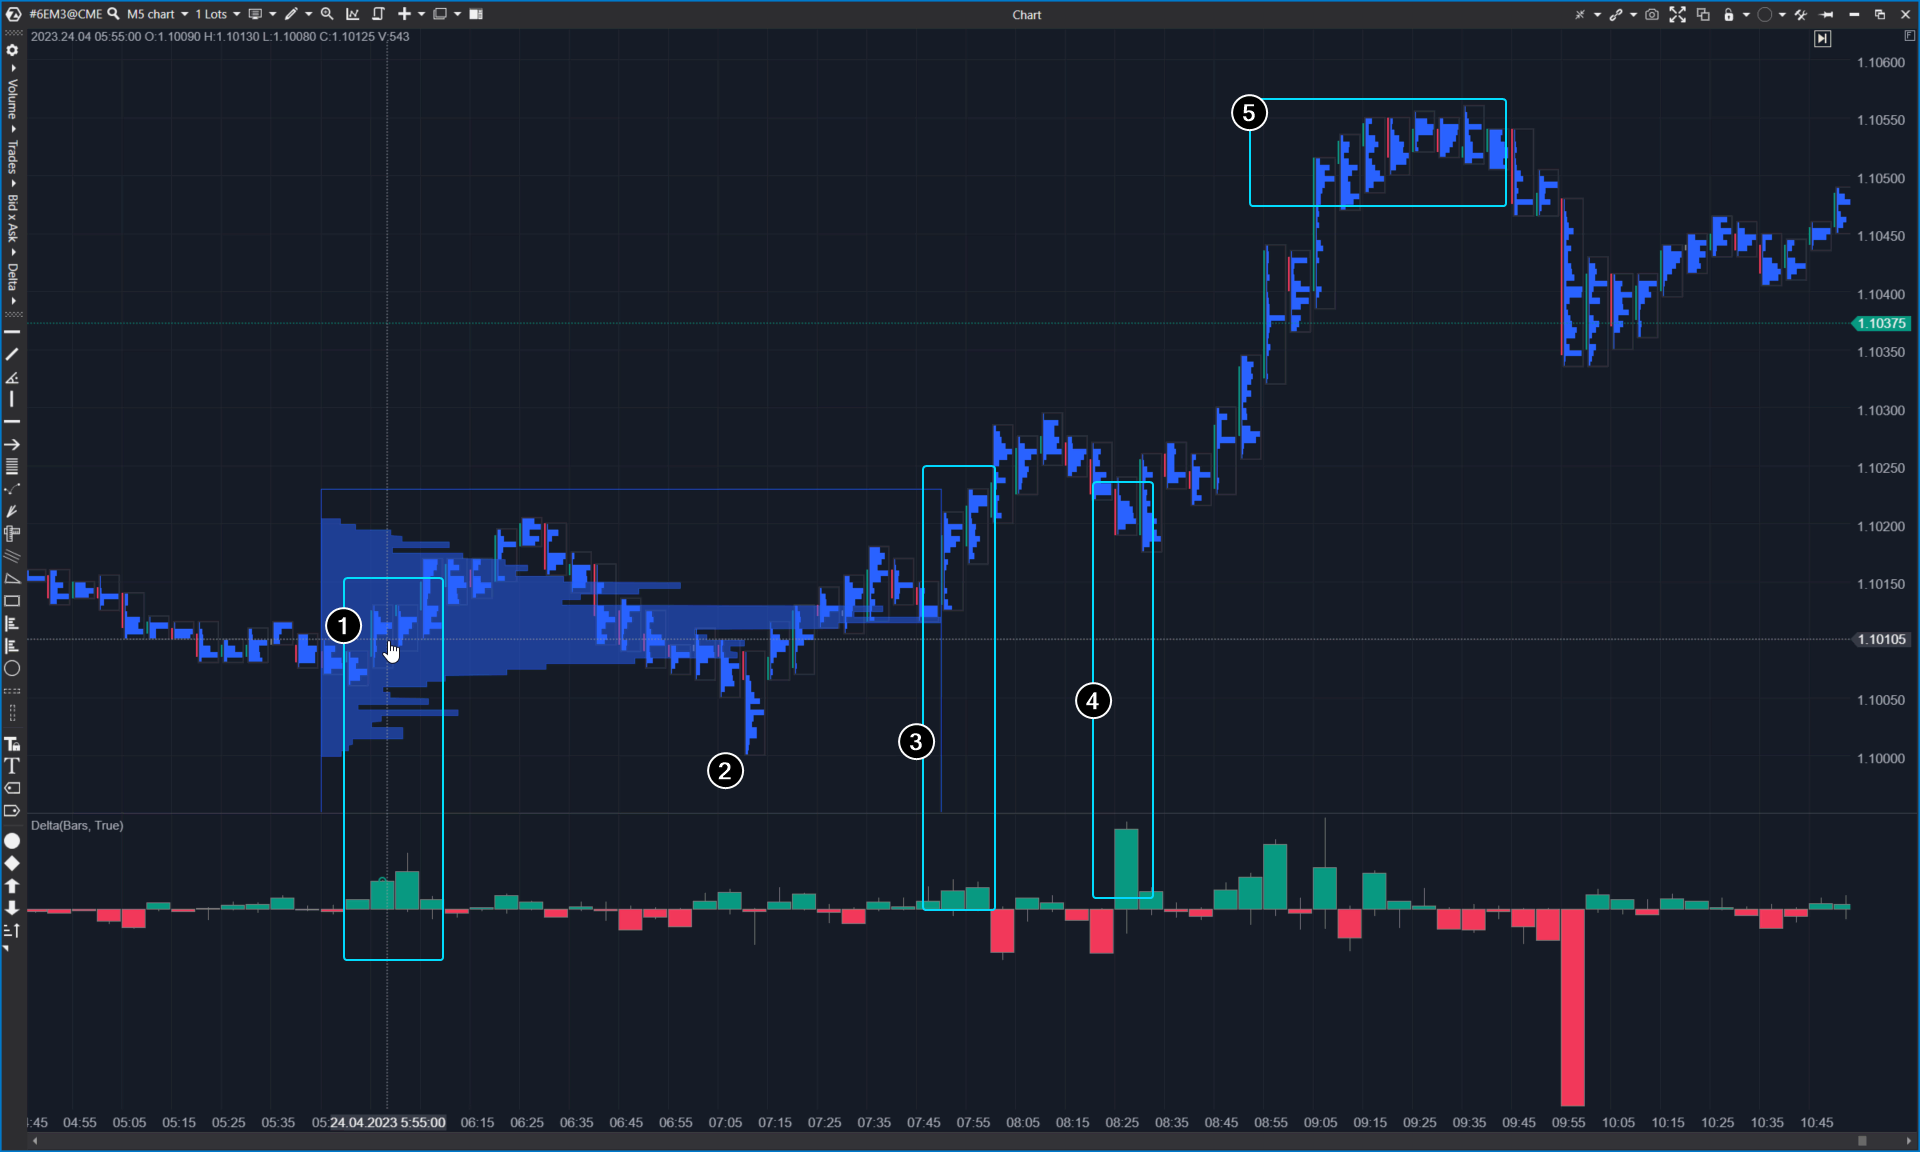
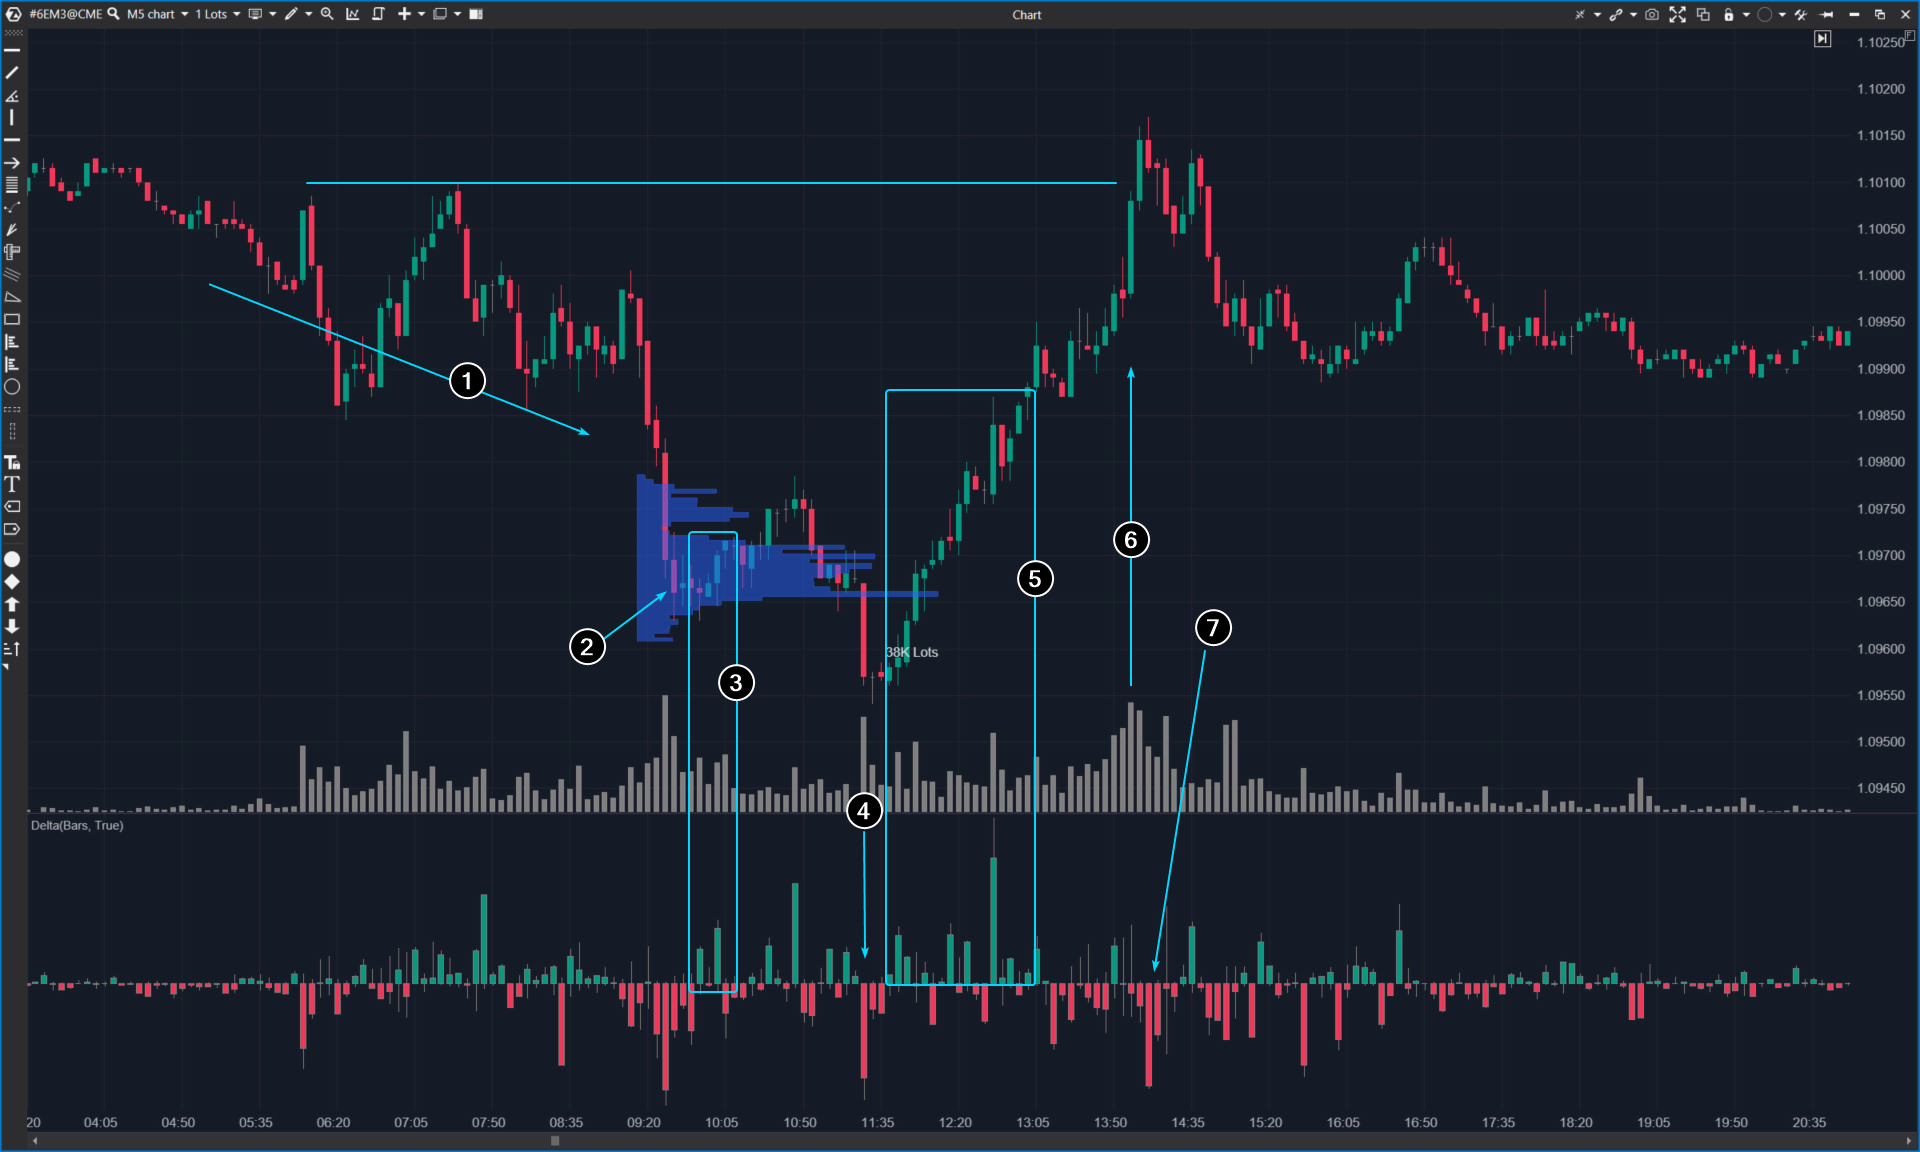
This is a timeline of one bullish day from the euro futures market. This is a footprint showing horizontal volumes inside each 5-minute candle. The delta indicator has also been added to the chart.
The chart reflects the trend diagram described at the beginning of the article.
Numbers indicate:
- A hypothetical large player sees the prospect of a bullish day and begins to form a long position. As the price rises on a positive delta, the bulge on the market profile becomes bigger at the 1,1012 level. Let’s assume that it is the average price at which the large player is accumulating contracts.
- A false bearish breakout before the start of an intraday uptrend. It is believed that during this breakout, the large player adds long to the position, buying more contracts that are sold due to the activated stop losses. The delta was negative, but it closed near zero, indicating demand exceeded supply.
Example 2
Another case is from the euro futures market, but this time it shows a V-shaped day.
To summarize briefly:
- Let’s say a large player has information that during the day, there will be positive news on the euro, and the current downtrend will reverse.
- They begin to form a long position, buying up the falling market with limit orders. We can see this from the narrowing spreads on high volumes.
- The player adds market orders to the position. But the market is not yet ready to rise.
- The large player adds to the position by buying up stop losses.
- When market conditions are favourable, a large player uses market buys to push the price up. This may be driven by positive news for the euro (or negative news for the dollar) that appears in the media.
- The rally’s culmination with the previous highs’ breakdown is already obvious to everyone. The masses go long (FOMO), and the pro closes the long with limit-sells.
- The pro closes the intraday position with long market sells and enjoys their life.
Example 3
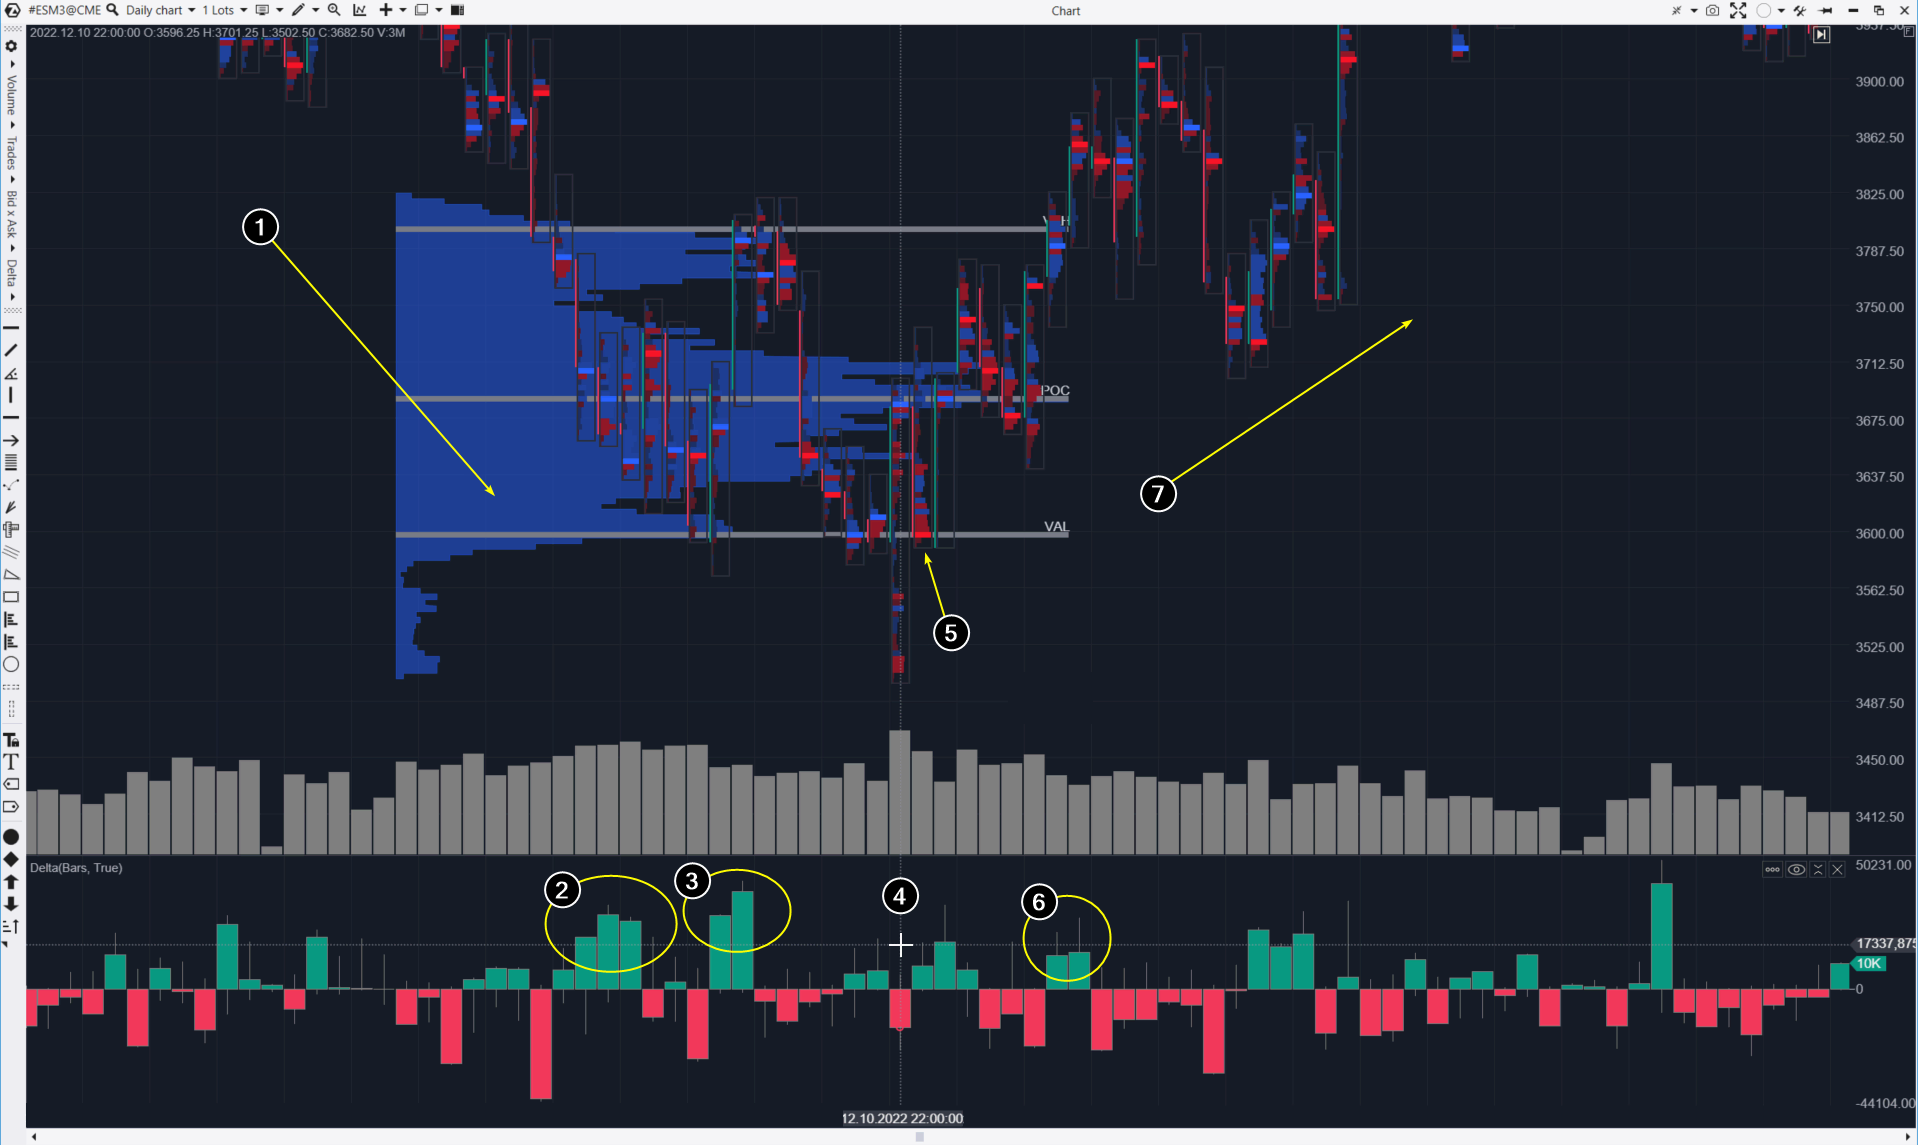
Another case of the footprint, the daily timeframe and the futures market for the S&P 500 index.
The chart shows a bullish reversal in fall 2022:
- There was a downtrend in 2022 amid rising inflation, Fed tightening policy, and concerns about a recession.
- A spike in positive delta indicates market buys. A hypothetical large player may have decided that the price had fallen enough (to the 3,700 level) to become attractive for accumulating a long position. Notice how bearish progress is slowing down.
- Another spike in buys occurred. However, those who had opened long positions in anticipation of a reversal acted hastily (this will be apparent in retrospect). The downtrend, which lasted for more than half a year, could not reverse so quickly. The price dropped from VAH to POC. Probably, a large player continued to form long positions.
- On October 12, amid an important news release, the price dropped below the VAL level. Sells that occurred at a minimum are likely to reflect the panic of retail traders (while a large player took advantage of this situation and bought from them, thereby completing the formation of a long position). Then the price rose to the POC level, and the session closed at the highs. Trading volumes were record-breaking, and the price dynamics indicated strong demand.
- The next day, the bears attempted to break through the VAL level, but their efforts were in vain, as the subsequent days revealed. It is worth noting the concentration of selling pressure in the market.
- A spike in positive delta indicates the efforts of a large buyer to break through the VAH level in order to push prices higher and establish an upward trend.
- Given the positive fundamental factors, the trader manages to achieve this – pullbacks to rising lows are holding at around the 50% level.
The article does not raise issues of risk control and money management. But that does not mean they can be ignored. Do not let a wrong decision lead to irreparable losses – no trader can be right 100% of the time.
BT
![]()
