WHAT LEVEL BREAKOUT TRADING IS BASED ON
⇒ Warning. Any strategy does not guarantee profit on every trade. Strategy is an algorithm of actions. Any algorithm is a systematic work. Success in trading is to adhere to systematic work.
Breakout trading is an approach in which a trader focuses on price movements through key support or resistance levels. The strategy is based on the assumption that if the price breaks through a support or resistance level, there is a possibility that the price will continue moving in the same direction.
Level building can be quite subjective. Different guidelines are used for this:
- previous extremum points;
- psychological meanings of prices;
- patterns of technical analysis;
indicator values (for example, high volume levels on the market profile).
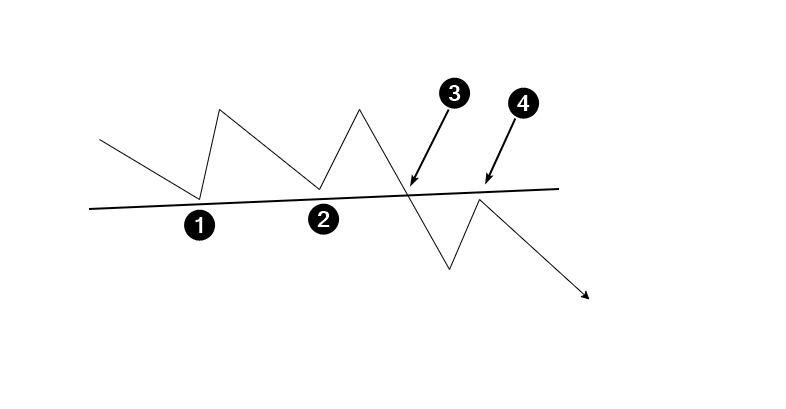
Levels can be inclined and horizontal, they can use a different number of guidelines. In general, trading on a breakout of a support level looks like this:
The diagram shows:
- 1 and 2 — local lows for building support;
- 3 — a bearish breakout of the support level;
- 4 — a breakout test (it is not always formed).
The opposite is true for a bullish breakout of a resistance level.
IDEA OF THE PATTERN
The idea of a breakout is to disrupt the balance of supply and demand.
Suppose that in the market, the forces of buyers and sellers were balancing each other out for a period of time. At the same time, the price was forming a trading range (was flat). The boundaries of a formed range (or a technical analysis pattern) usually define support and resistance levels.
Let’s continue to develop the hypothesis. Under the influence of some negative factors, buyers weakened, sellers became more active, and the price began to fall. At the same time, there was a breakout of the support line — market participants reached a consensus that the price for the asset is too high, and the fair price is lower. At this moment, sellers become very active, which leads to a breakout.
HOW TO IDENTIFY A BREAKOUT USING VOLUME INDICATORS
Experienced traders may notice that:
- when the price is about to break through a level, the trading volume usually increases as it approaches that level;
- before a true breakout occurs, there is usually a false breakout (a deceptive maneuver) in the opposite direction;
- breakouts occur rapidly, leaving little time for traders to analyze and enter a position at a bargain price. Moreover, opening a trade in the direction of a breakout, a trader may feel emotional discomfort due to the potential of buying at a high price or selling at a low one.
How to confirm a breakout to trade more confidently?
Look for clear evidence of one party’s dominance over the other. It can be found using advanced volume analysis indicators of the ATAS platform. For example:
- Stacked Imbalances shows the dominance (imbalance) of one of the parties by analyzing several price values in a row. The imbalance usually occurs in the breakout area. This indicator can also be used for money management, as will be shown below.
- Speed of Tape in delta mode will give evidence of increasing pressure of one of the parties over time.
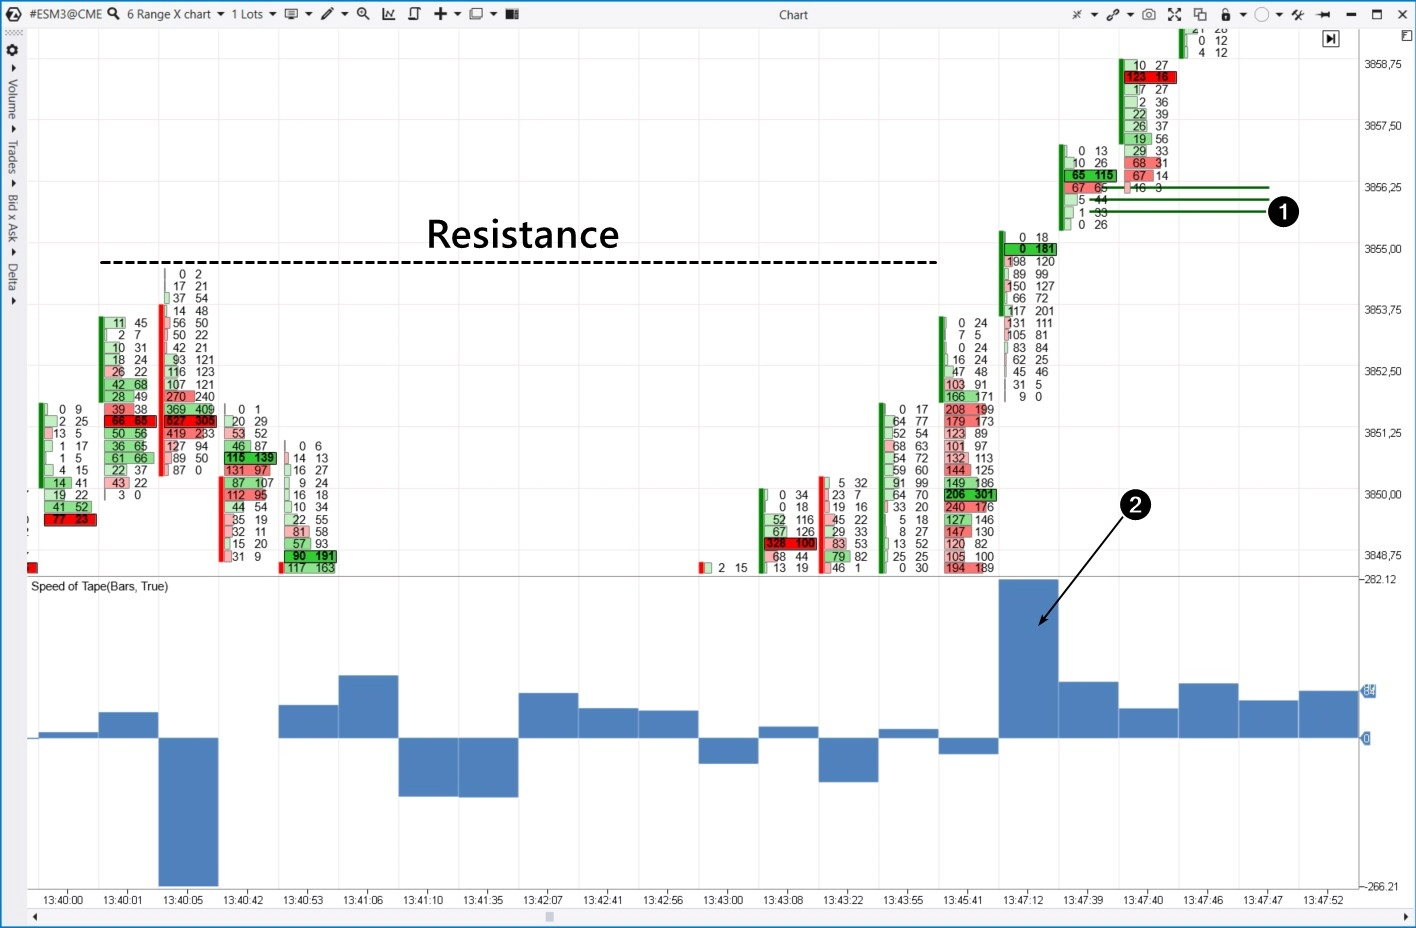
The cluster chart below illustrates a breakout of the resistance level.
The numbers indicate:
- Dominance of buyers over sellers (1), which is noticeable by the difference between bought (in the right column) and sold (in the left column) contracts at several price values. The green bars of the Stacked Imbalances indicator show this situation.
- Trade execution speed (2). The Speed of Tape indicator is a unique development of ATAS programmers. It does not follow a theoretical formula, but it can be a valuable instrument in practice.
Let’s have a look at how different indicators behave during breakouts on charts of various instruments. We have chosen Range X charts — if the breakout occurs quickly, standard time frames may receive indicator signals with a delay. The Range X chart allows you to compensate for this nuance.
S&P-500 Example 1. Futures on the S&P-500 index
The Stacked Imbalances indicator allows you to look for imbalances between buyers and sellers without looking inside the candles. This allows you to control the bigger picture, evaluate the interaction of price and indicator signals.
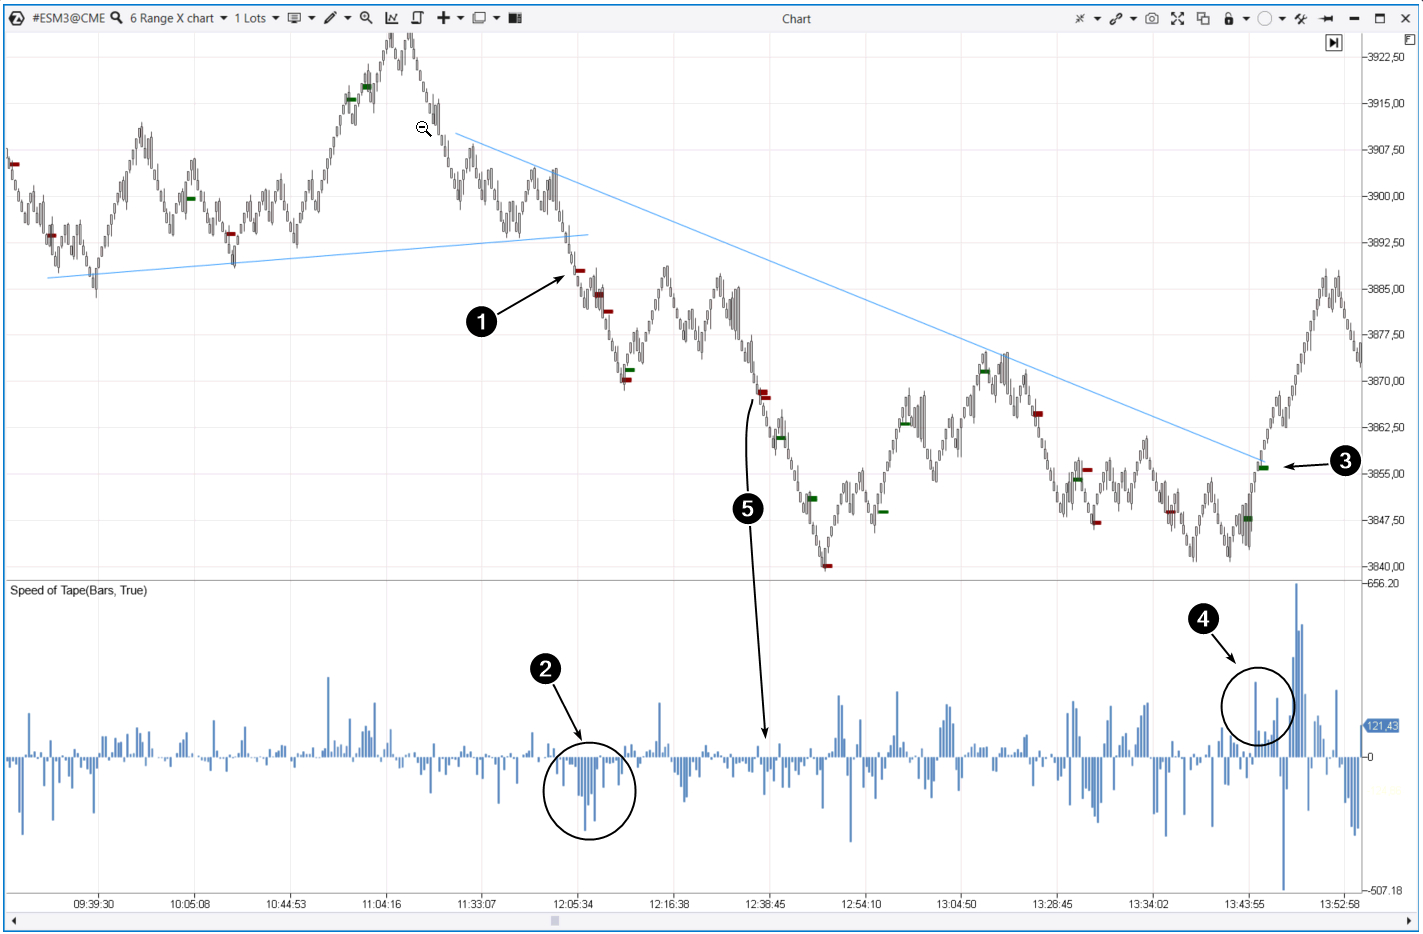
The numbers indicate:
1 — the signal of the Stacked Imbalances indicator, showing the dominance of sellers at several levels. Notice that there are local lows in the background.
2 — evidence that sellers are accelerating. Combine it with the Stacked Imbalances signal and you will get confirmation that the sellers indeed have the upper hand.
3 — the signal of the Stacked Imbalances indicator shows the dominance of buyers at several levels in case of a bullish breakout of the inclined resistance line with several local highs in the background.
4 — evidence that buys occur on the market at a faster speed.
5 — another example of a bearish signal from two indicators on a downside breakout of the previous low.
Example 2. Euro futures
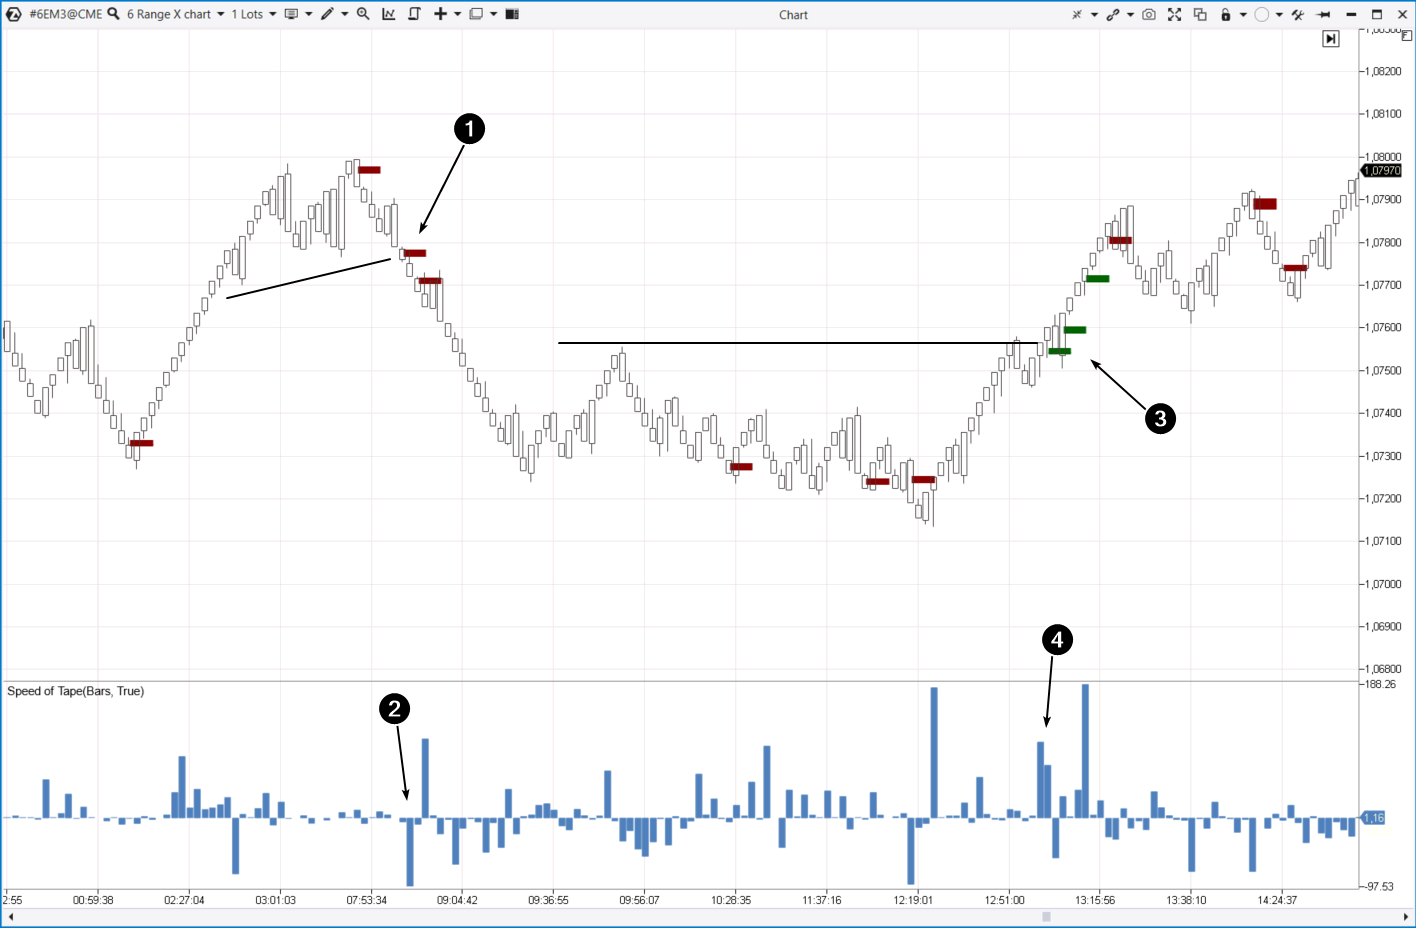
The numbers indicate:
1 — the signal of the Stacked Imbalances indicator shows that a greater number of sells is recorded at several price levels in a row.
2 — the Speed of Tape histogram shows a spike in selling speed when the support line is broken.
3 — the signal of the Stacked Imbalances indicator shows that the number of buys exceeds sells when trying to break through the resistance level. This gives reason to believe that the breakout will occur.
4 — evidence that buys occur on the market at a faster speed.
Example 3. Cryptocurrency market. Litecoins
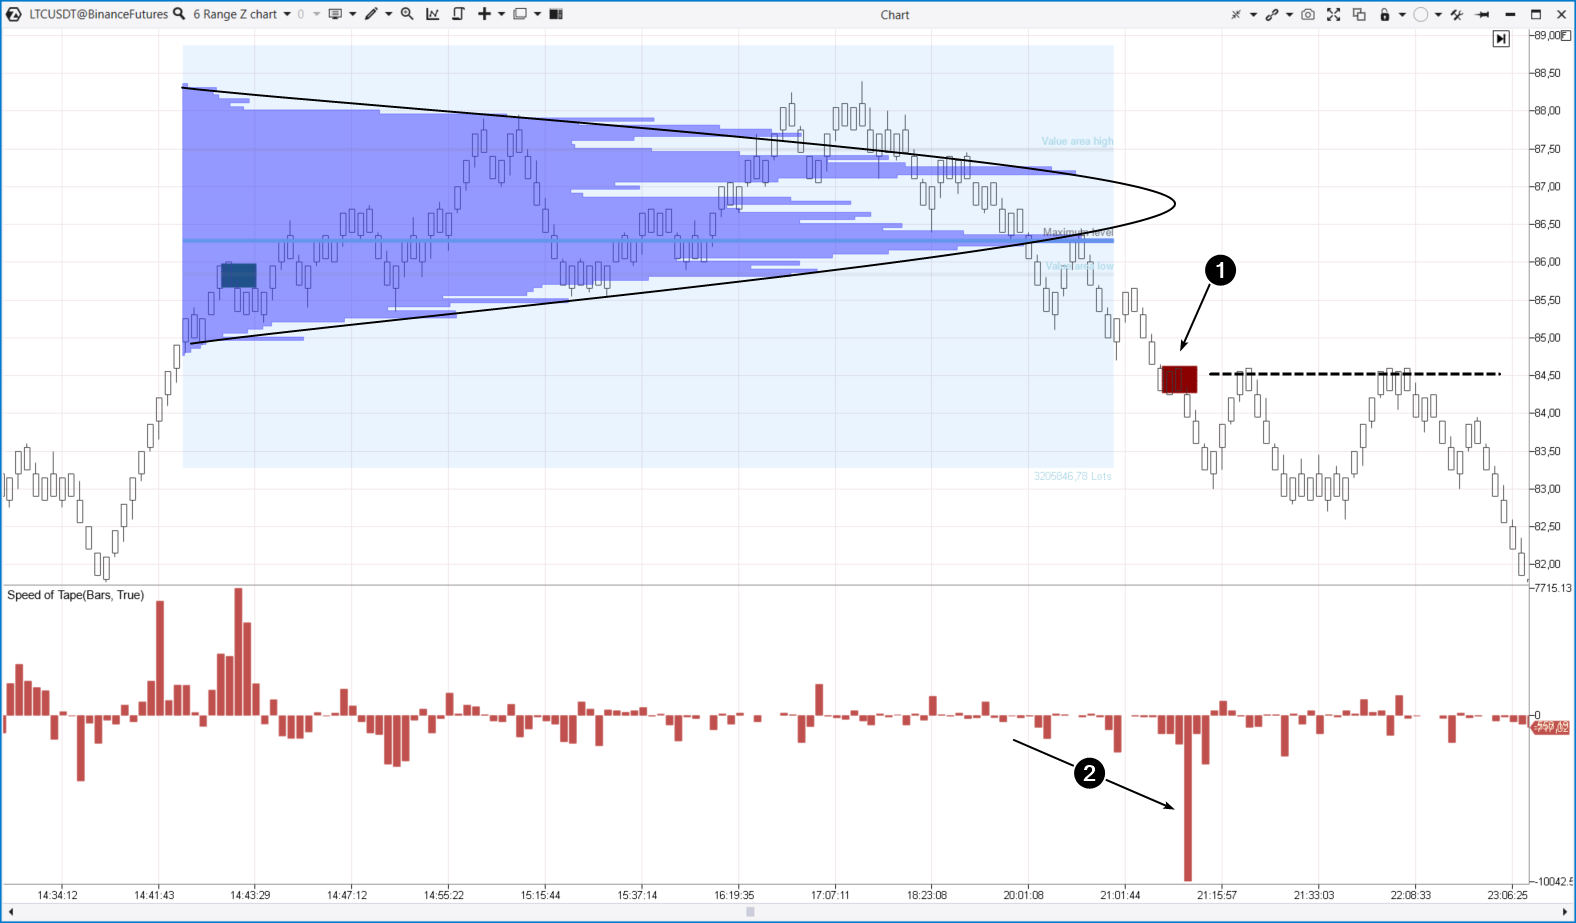
The range chart below from the Binance Futures exchange shows how the market stabilized after rising above $85 per coin. This is indicated by the bell-shaped profile, which suggests that supply and demand are balanced. You can build a resistance level near the upper border of the bell and a support level near the lower border.
Later, the price was influenced by negative factors and began to decrease. The signal of the Imbalances indicator (1) appeared on the chart, and the Speed of Tape indicated an acceleration of the selling pressure. There was a bearish breakout.
Pay attention to the line drawn from the signal of the Stacked Imbalances indicator (marked with a dotted line). It began to act as a resistance level. This can serve as a guideline for setting stop-losses or entering a position when testing this level.
HOW TO TRADE BREAKOUTS, STRATEGY DEVELOPMENT
It is important to understand that Stacked Imbalances, Speed of Tape or any other indicator cannot give accurate signals that guarantee profit. Each trader is personally responsible for choosing the appropriate indicators and configuring their settings.
However, there are some general steps that can help you build a strategy for trading level breakouts, regardless of which indicators and settings are chosen:
- Identify key support and resistance levels on the price chart.
- Wait for the level breakout. You can enter a trade either directly during the breakout or once the breakout is confirmed, and the price has fixed on the level.
- Set a stop-loss and target for profit. The balance of risk and reward should be in your favor.
Remember that the price can sometimes break through the levels, but then quickly turn around and move in the opposite direction. Therefore, it is important to use risk management strategies to limit potential losses.
HOW TO QUICKLY LEARN TO TRADE LEVEL BREAKOUTS WITHOUT RISKS
Practice using the Market Replay simulator as often as possible. No pain — no gain.
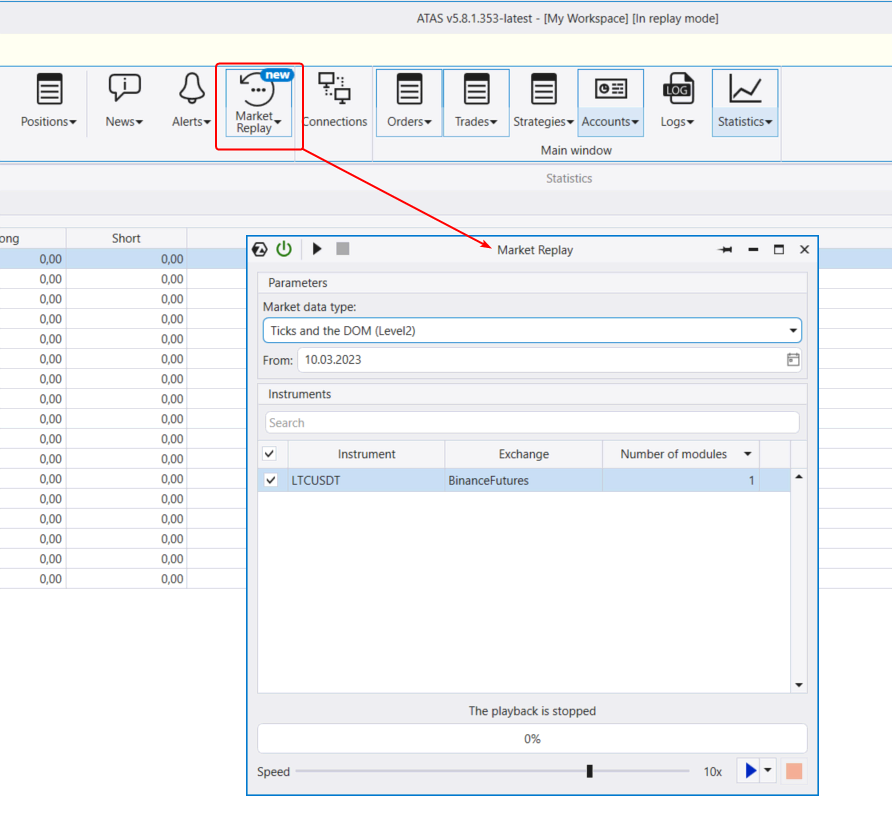
Market Replay can be launched from the main menu of the ATAS program.
Choose the market you are interested in, adjust the quality of market data (using the highest quality, you can analyze limit orders in the DOM), set the dates and run the tester — the data will be loaded automatically. You can trade on history as if in real time and adjust the playback speed.
Practice trading breakouts and quickly gain experience without risking real money.
BT
![]()
